System IP, Debug and Trace Architecture, and RAS
September 8, 2026162 min readadvanced
Do not start from a block diagram. Start from a machine that has a problem, and let the block diagram be the thing that solves it.
01.Part 1, why an interrupt controller exists at all
1.1 Three devices, one core, and a stopwatch
Do not start from a block diagram. Start from a machine that has a problem, and let the block diagram be the thing that solves it.
The machine is one processor core at 1 GHz, so one cycle is 1 nanosecond, and three peripherals.
The first is a serial port running at 115,200 baud. Serial framing sends ten bits per byte once you count the start and stop bits, so the port delivers characters per second, one every 86.8 microseconds. If the software does not take a character out of the port's one-byte holding register before the next one arrives, the next one overwrites it and a byte of input is silently lost.
The second is a periodic timer that must be serviced once every millisecond, because the operating system uses it to decide whether the currently running task has used up its slice.
The third is a DMA engine that copies a block of memory and then needs a new descriptor. It finishes a block roughly every 200 microseconds, but from the instant it finishes, it is idle and the memory bandwidth it was using is being wasted. Call the requirement that software must notice within 5 microseconds.
That is the whole system. Everything in Parts 1 and 2 is an answer to the question of how the core learns that one of those three things has happened.
1.2 Doing it by asking, and the arithmetic that kills it
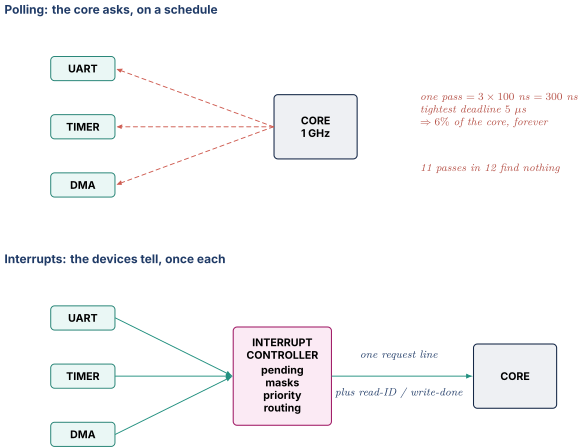
The obvious method needs no new hardware at all. The core reads a status register in each device, in a loop, forever. This is polling, and it is worth pricing properly because the price is the entire argument.
A status register lives in a peripheral, not in the cache. Reading it is an uncached load that leaves the core, crosses the interconnect, waits for a slow peripheral bus, and comes back. A round trip in the region of 100 nanoseconds is a fair public order-of-magnitude figure for such an access on an embedded system-on-chip, and it can be several times worse on a large one. Take 100 ns. Three devices is one poll pass of
Now the trap, and it is the point of the whole section. The rate at which you must poll is set by the tightest deadline, not by the rate at which events actually happen. The tightest deadline here is the DMA engine's 5 microseconds. So the loop must run every 5 µs whether or not anything is happening, and it costs
Six percent to service devices that between them produce events per second, which is one event every 57 microseconds. Since a poll pass happens every 5 µs and an event happens every 57 µs, roughly eleven poll passes in twelve find nothing at all. The core is paying full price for an answer that is almost always "no."
Then scale it, which is where it stops being merely wasteful and becomes impossible. A real system-on-chip has not three interrupt sources but dozens to hundreds: several UARTs, several timers, an I²C controller, SPI, USB, Ethernet, a display controller, a camera pipeline, an audio block, a crypto engine, several DMA channels, a PCIe root port, a temperature sensor, a watchdog. At thirty devices the pass costs 3 microseconds and the loop consumes 60 percent of the core. At a hundred devices, one pass takes 10 µs and the loop can no longer even meet a 5 µs deadline. Polling has not become expensive. It has become arithmetically impossible.
There is a second failure that is worse than the first and does not show up in the percentage. To bound the response time, the poll must happen every 5 µs on every code path, including inside the compression routine, inside the string library, inside the interrupt-free critical section somebody wrote three years ago. You cannot write ordinary software that way. Polling does not just cost cycles, it costs the ability to structure a program.
The fix is to invert the direction of the question. Instead of the core asking each device, each device tells the core. Cost then becomes proportional to the number of events, which is 17,520 per second, rather than to the number of deadlines, which was 200,000 per second. That inversion is the interrupt.
1.3 Doing it with one wire each, and the arithmetic that kills that too
Give each device a wire into the core. When the device wants attention it drives its wire high. The core sees it, saves its current work, and jumps to a handler.
For three devices this genuinely works, and small microcontrollers really are built this way. But now write down what the core has to contain to support it, because that list is the derivation of the block this Part is about.
The core needs, per wire, a bit of state saying whether that wire is currently asserted and unserviced. It needs a mask bit, because software must be able to say "not now" while it is in the middle of updating the data structure that handler touches. It needs a place to record which handler address corresponds to that wire. And it needs comparison logic that decides, when three wires are asserted at once, which one to service first. That is a priority encoder, and its width grows with the number of wires.
Multiply by 200 sources and three things break at once. Pins and ports. Two hundred wires terminating on a core is two hundred inputs the core's boundary has to carry, routed from all over the die, and a core is an object you want to instance four or eight times without rewiring the chip each time. Core state. Two hundred pending bits, two hundred mask bits and a two-hundred-way priority encoder are now part of the core's architectural and physical state, so every change to the peripheral mix is a change to the core. Multiple cores. With four cores you either replicate all two hundred wires four times, which is eight hundred wires, or you build something in the middle that decides which core gets what. That something is the block we are deriving.
So factor the common logic out of the core into one place. What remains inside the core is the narrowest possible interface, essentially one signal saying "an interrupt is waiting", plus a way to ask "which one" and a way to say "done." The pending state, the masking, the priority and the routing all move into a shared block sitting between the devices and the cores.
That block is the interrupt controller, and it was not designed so much as left behind by the factoring.
1.4 Level and edge, and the distinct bug each one has
Before any of the sophisticated machinery, settle how a device says "I want attention", because the two possible answers have completely different failure modes and interviewers ask about this constantly.
Level-sensitive means the device holds its wire asserted for as long as its condition is true, and de-asserts only when software has done something to the device that clears the condition, by reading the received character out of the UART, or by writing the "clear" bit in the DMA status register. The controller regards the source as pending whenever the wire is high.
Edge-sensitive means the device pulses its wire, and the controller latches the transition into a pending bit. The pulse can be as short as one cycle. The pending bit stays set until something explicitly clears it.
Now the failure of each, concretely.
Level's failure is the interrupt storm. Suppose the handler returns without clearing the device's condition, because of a driver bug, or because it read the wrong register, or because a second character arrived and re-asserted the line before the handler finished. The wire is still high. The controller immediately signals again, the handler runs again, and the machine makes no forward progress at all. It is not hung in the sense of stopping, it is livelocked in the sense of doing nothing but entering and leaving a handler. The bounding discipline is exact and worth stating as a rule. With a level-sensitive source the handler must clear the condition at the device before it tells the controller it is finished, and if it cannot, the source must be masked.
Edge's failure is the lost interrupt, and it is worse because it is silent. Take the UART again. A character arrives, the device pulses its line, the controller latches pending, the core enters the handler. While the handler is running a second character arrives and the device pulses again. If the controller has already cleared the pending bit as part of dispatching, it latches the second pulse and all is well. But if the pending bit is cleared after the second pulse arrives, which is exactly what happens when the handler writes "clear pending" at the end rather than the start, the second edge is erased. The wire is now low. The pending bit is now clear. The character is sitting in the UART and nobody will ever be told about it. The port stops working and there is nothing in any register to say why.
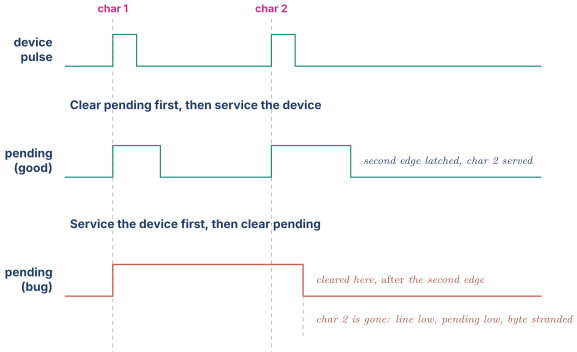
The generalisation is the one to say out loud. A level-sensitive source is self-healing and prone to storms. An edge-sensitive source is efficient and prone to silent loss. Level is the safer default for anything whose condition persists, which is most peripherals. Edge is right for genuinely instantaneous events such as a pin toggling, a message arriving, or a counter wrapping, and it obliges the designer to get the clear-before-service ordering right. Real controllers make the choice programmable per source, because the choice belongs to the device and the controller does not know what is wired to it. Arm's GIC configures it per interrupt ID in GICD_ICFGR for shared interrupts, and in the equivalent redistributor register for a core's private ones in GICv3. RISC-V's PLIC handles the difference in a per-source gateway that converts whatever the device does into the PLIC's internal request-and-complete discipline.
One more level-only subtlety, because it is a real bug class in shared systems. If two devices share one level-sensitive line, wired-OR, then the line stays asserted after the first handler has cleared its own device, because the second device is still asserting. The handler chain must therefore keep walking the list of possible sources until a full pass finds none asserted. Stopping after the first match leaves a permanently asserted line and produces the storm again. That is why shared level interrupts are considered a design smell and why message-signalled interrupts in Part 3.4 were such a large improvement.
02.Part 2, what a real interrupt controller has to decide
The block we derived has to answer five questions. Which sources are asking. Which of them is allowed to be heard. Which one is most important. Which core should handle it. And when is it over. Each has a hardware answer worth knowing.
2.1 Priority, worked before it is defined
Take the three devices again and add a fourth, a watchdog that fires if software has stopped kicking it. Assign priority numbers. Settle first which direction the scale runs, because it is not universal and it is exactly the kind of detail worth checking rather than assuming. Arm's GIC treats a numerically lower value as more important. RISC-V's PLIC runs the other way, so a numerically higher source priority is the more urgent one, and priority zero means "never interrupt". The table below uses the GIC convention.
| Source | Priority value | Handler runtime | Deadline |
|---|---|---|---|
| watchdog | 0 | 2 µs | immediate |
| DMA completion | 32 | 3 µs | 5 µs |
| UART receive | 64 | 1 µs | 86 µs |
| OS tick | 128 | 8 µs | 1 ms |
Now run a scenario. At the OS tick fires and its 8 µs handler starts. At s the DMA completes, with a 5 µs deadline.
Without priority, the controller has two equally bad options. It can make the DMA wait for the tick handler to finish at s, which is a response 7 µs after the request against a 5 µs requirement, so two microseconds late before the DMA handler has even started, and 5 µs late by the time it has run. Or it can dispatch in arrival order, which is the same thing. With priority and preemption, the controller notices that the pending DMA request at priority 32 outranks the tick handler running at priority 128, so it asserts the request line again while the tick handler is running. The core takes a nested exception at s, runs the 3 µs DMA handler, returns at s, and the tick handler resumes with 7 µs of work still to do and finishes at s. Both deadlines are met, and the only thing that got worse is the tick, which had a millisecond of slack.
That scenario is the entire justification for two mechanisms.
Priority comparison. The controller stores a priority value per source and, among all pending-and-enabled sources, presents the smallest. That is a priority encoder over the pending vector, which is the structure in Arbiters FIFOs and CAMs, and at hundreds of sources it is a real timing problem solved the usual way, hierarchically: a per-group winner, then a winner among groups, pipelined so that the comparison is not in the same cycle as the dispatch.
Running priority and preemption. The controller must remember the priority of what the core is currently running, not merely what is pending. When a source is dispatched, its priority becomes the core's running priority, and a new source only preempts if it is strictly more important than that. Without this the machine oscillates: a source of equal priority interrupts its own peer, and a handler can preempt itself. The running priority is naturally a small stack, because nesting is a stack, and its depth bounds the nesting depth.
Two engineering consequences drop out immediately and are good things to volunteer.
Preemption costs stack. Every nesting level saves a register context. Eight priority levels with unrestricted preemption means the worst-case interrupt stack is eight contexts deep, and on a small system that is a real memory budget rather than a detail. This is why controllers implement priority grouping: the priority field is split by a binary point into a group part that decides preemption and a subgroup part that only decides ordering among simultaneously pending requests. Arm's GIC exposes this as the binary point register. Setting the binary point so that only two groups exist bounds the nesting depth at two regardless of how many distinct priority values are configured.
And preemption costs determinism. The worst-case latency of a low-priority handler is now its own runtime plus the sum of every higher-priority handler that can occur during it. Real-time analysis of an interrupt system is exactly this sum, and it is why safety-critical systems in Part 9 often forbid nesting entirely and accept worse average latency for a bound they can prove.
2.2 Masking, which happens in three different places
"Masking" names three distinct mechanisms that are frequently confused, and being precise about which one you mean is a cheap way to sound like you have debugged this.
At the source, in the controller. A per-source enable bit. Clearing it means this source is ignored entirely: it may still become pending, but it will never be selected. This is the surgical one, used by a driver that is about to touch a data structure its own handler uses. Set and clear are usually implemented as separate write-one-to-set and write-one-to-clear registers rather than a read-modify-write field, precisely so two cores can disable different sources without a lock. That is a small design detail with a large correctness consequence and it generalises everywhere.
At the interface, by priority threshold. A register holding a priority level, where any source whose priority is numerically worse than the threshold is not signalled. Arm calls it the priority mask register, ICC_PMR_EL1. RISC-V's PLIC calls it the threshold register and provides one per context. This is the blunt one and the useful one. Raising the threshold to 32 lets the watchdog and the DMA through while silencing everything else, in a single register write, with no knowledge of the source list. Software that implements interrupt-priority levels, the classic operating-system notion of raising the interrupt priority level, implements them with this register.
At the core, by a global disable. A bit in the core's own state that stops it accepting interrupts at all: PSTATE.I on AArch64, MIE/SIE in RISC-V's mstatus, the interrupt flag on x86. The controller keeps signalling, the request stays asserted, the core does not look. This is the cheapest and the most dangerous, because it is global, and the discipline is to hold it for the smallest possible number of instructions. Every microsecond spent with interrupts globally disabled is a microsecond added to the worst-case latency of every source in the system, including the watchdog.
The distinction that matters for a hardware designer is this. The first two live in the controller and are per-source or per-core-interface state. The third lives in the core and is architectural. A question like "how would you make sure a driver never misses an interrupt while it updates its ring buffer" has a correct answer of "mask that source, not all sources," and the follow-up "why not just disable interrupts globally" has the answer above.
2.3 The life cycle, and what the end-of-interrupt handshake is really for
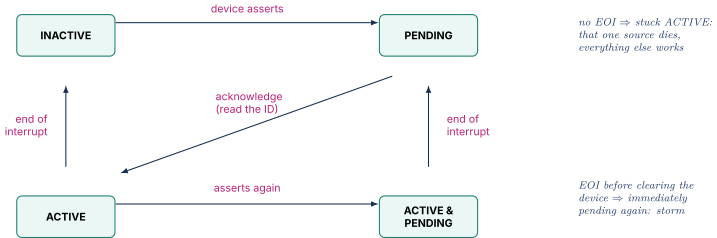
Every interrupt source in a real controller is a small state machine with four states, and it is worth walking rather than listing.
Inactive. Nothing is happening.
Pending. The device has asked. For an edge source this is a latched bit. For a level source it is the wire being high. The source is now a candidate for selection.
Active. The core has acknowledged this specific source and is running its handler. It is no longer a candidate, because you do not want to be re-selected for the thing you are already doing.
Active and pending. The core is running the handler and the same source has asked again. This state exists because the alternative is losing that second request. When the handler finishes, the source returns to pending rather than inactive, and runs again.
The transition out of active is what the end-of-interrupt handshake performs, and the reason it exists is not obvious until you try to remove it.
Suppose there were no EOI. The controller would have to guess when the handler is done. It cannot. The handler is software of unknown length that may itself have been preempted. If it de-activated the source immediately on acknowledgement, then a level-sensitive line that is still asserted, which it will be for most of the handler's duration because the handler has not yet cleared the device, would instantly be re-selected, and you have the storm from 1.4. If it never de-activated the source, the source would fire exactly once and never again.
So the handler must tell the controller. The full sequence, for a level source, is exact and the order is load-bearing:
- The core takes the exception and acknowledges, reading the interrupt ID from the controller. The source goes active and the core's running priority becomes that source's priority.
- The handler services the device, doing whatever clears the condition at the peripheral, which de-asserts the wire.
- The handler writes end-of-interrupt to the controller with the same ID it read. The source goes inactive and the running priority is restored.
Do step 3 before step 2 and the line is still asserted when the source de-activates, so it is immediately pending again: storm. Skip step 3 entirely and the source is stuck active forever: that peripheral is dead and nothing else has changed, which is a maddening bug because everything else on the machine still works.
Why GICv3 splits it in two. Arm's version separates the single conceptual EOI into two operations that can be done at different times. Writing ICC_EOIR1_EL1 performs a priority drop, restoring the running priority so that other interrupts of similar priority can now preempt. Writing ICC_DIR_EL1 performs the deactivation, moving the source out of active. Whether the first also does the second is controlled by the EOImode bit. With EOImode = 0 the single write does both, which is what a plain operating system wants. With EOImode = 1 they are separate.
The separation exists for virtualisation. A hypervisor wants to hand a physical interrupt to a guest, but the guest must not be able to deactivate a physical source directly, and the physical source must stay active until the guest is really finished with it, which may be a long time and may involve the guest being descheduled. So the hypervisor drops the priority immediately, so that the rest of the system is not blocked at the guest's priority, injects a virtual interrupt into the guest, and performs the physical deactivation later when the guest signals completion. Being able to explain that is a much stronger answer than reciting the register names, because it shows the mechanism is there for a reason rather than as an Arm quirk.
2.4 Affinity, or which core should take it
With one core there is nothing to decide. With eight there is, and the choice is a genuine architectural question rather than a configuration detail.
Pin it to a specific core. The controller holds, per source, a target identifier, and always signals that core. This is what you want when the handler touches per-core state, when a device is physically near one cluster, or when a real-time task must run on a core whose cache is warm and whose frequency is fixed. It is also what you want for reproducibility, which matters more than it sounds: an interrupt that lands on a different core on each run is a bug that reproduces on Tuesdays.
Let the controller choose. The controller signals whichever eligible core is most able to take it, typically defined as a core that is not already at a higher running priority, with hardware breaking ties. Arm calls this 1-of-N distribution and it is selected by a bit in the routing register rather than by naming a target. It balances load without software involvement, and it is the wrong choice whenever the handler has affinity to per-core state.
Broadcast. Every core takes it. Used for a small number of system-level events and essentially never for device interrupts, because cores all entering a handler to service one device is wasted entries and a lock fight.
Arm expresses the target as an affinity value rather than a flat core number, because a large system is a hierarchy rather than a list. MPIDR_EL1 gives each processing element a four-level identifier written Aff3.Aff2.Aff1.Aff0, mapping onto something like socket, die, cluster, core, and the distributor's routing register GICD_IROUTER for each shared interrupt holds either such an affinity value or the "any participating core" bit. The hierarchy is not decoration: it lets the controller route to a whole cluster, and it lets the distribution hardware avoid sending a request across a die boundary when a local core will do.
The design consequence for the hardware is that routing state is per source, so a controller implementing the full shared range, INTIDs 32 to 1019 and therefore 988 shared peripheral interrupts, holds 988 routing entries, each wide enough for an affinity value. That is a real array, it wants to be a small RAM rather than flops, and it must be written safely while interrupts are live. That is why real specifications are explicit about what happens if you change the routing of an interrupt that is currently pending. The safe software sequence is to disable the source, change the route, then re-enable. Hardware that does not make that safe has created a bug that appears once a month under load.
2.5 Cores interrupting each other
The last category has no device behind it at all. One core needs another core's attention: to tell it a page table changed, to wake it from idle, to ask it to reschedule, to stop it for a debug halt. That is an inter-processor interrupt, and in Arm's vocabulary a software-generated interrupt, SGI.
The mechanism is a register write. The sending core writes a target and an interrupt number to a register in the controller. In GICv3 that register is ICC_SGI1R_EL1, which encodes the target affinity and a bitmask of cores within the lowest affinity level. In the RISC-V CLINT it is a write to the per-hart msip location, which is about as simple as an IPI can be. The controller makes that interrupt pending on the target and everything else proceeds as normal.
Two properties matter to a designer. IPIs are the mechanism underneath TLB shootdown, scheduler wakeup and cross-core function calls, so their latency is on the critical path of the operating system, not of a peripheral, and a slow IPI shows up as poor multi-core scaling rather than as a driver problem. And IPIs are the one interrupt class where the sender is software and the number of them is unbounded, so the controller must not have a structure that can be exhausted by a core sending IPIs in a loop.
03.Part 3, the real implementations
Everything in Part 2 exists, under specific names, in two public architectures worth knowing by name because both come up in interviews across the companies screening for this material.
3.1 Arm's GIC, and why it is three blocks instead of one
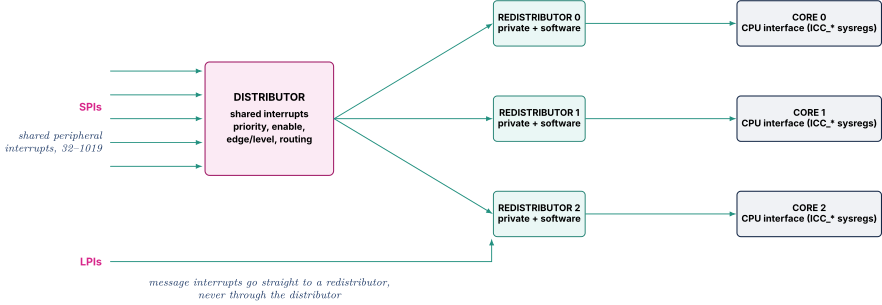
The Generic Interrupt Controller could have been one block. It is specified as three, and the reason is physical rather than logical.
The distributor, one per system, owns everything that is shared: the configuration, priority, enable and routing state for interrupts that any core might take. It is the part with the big arrays and the wide priority comparison, and it sits somewhere central on the die.
A redistributor, one per processing element, owns everything that is private to that core: the state for that core's private and software-generated interrupts, the control of that core's power state as far as interrupts are concerned, and, in GICv3, the configuration and pending tables for the locally-targeted message interrupts of 3.5. It sits physically near its core.
The CPU interface, one per processing element and in GICv3 built into the core itself as a set of system registers rather than a memory-mapped block, is the part the handler actually touches: acknowledge, priority mask, end-of-interrupt, deactivate.
The split is a floorplan decision made visible in an architecture specification. Acknowledge and EOI happen on every single interrupt, so those hot, latency-critical, per-core operations became system register accesses inside the core, costing a few cycles rather than a memory-mapped round trip across the fabric. That change from GICv2's memory-mapped CPU interface to GICv3's system-register interface is the single largest performance difference between the two, and it is a good example to have ready of a specification changing shape for physical reasons.
3.2 The four kinds of interrupt, and the number space
The GIC gives every interrupt an INTID and partitions the number space by kind, which is a compact way of encoding whether the state is shared or private.
SGIs, software-generated interrupts, INTIDs 0 to 15. Generated by a core writing a register. Private per core: SGI number 3 on core 0 and SGI number 3 on core 1 are different interrupts with separate state.
PPIs, private peripheral interrupts, INTIDs 16 to 31. Wired from something that exists once per core, such as its own timer, its own performance monitor, or its own debug and RAS signalling. Also private, so all cores use the same number for their own copy.
SPIs, shared peripheral interrupts, INTIDs 32 to 1019. The ordinary device interrupts, wired into the distributor, routable to any core.
LPIs, locality-specific peripheral interrupts, INTIDs from 8192 upward. Message-based, always edge-like in behaviour, and the subject of 3.4 and 3.5. Their configuration and pending state live in memory tables rather than in registers, which is the whole point: you cannot put a register bit per interrupt on a chip that needs a hundred thousand of them.
A handful of IDs in the 1020 to 1023 region are reserved for special meanings, of which the one to remember is the spurious ID. Reading the acknowledge register when nothing is actually pending returns it, and the handler is expected to return without doing anything. That is not a curiosity, it is a necessary escape hatch, because the acknowledge is a read that races with de-assertion. Later versions of the architecture add extended ranges above these, the extended PPIs and the extended SPIs, for systems that ran out. The exact boundaries of the extended ranges are the kind of number to look up rather than to quote from memory in an interview.
3.3 The handling sequence, register by register
Worth walking once because it is a fair interview question and because the shape recurs in every controller.
The distributor and redistributor decide there is a pending, enabled interrupt whose priority beats this core's current running priority and whose priority also passes ICC_PMR_EL1. They assert the core's IRQ or FIQ input. The core takes the exception per the ordinary exception rules of CPU Foundations Pipeline and Hazards.
The handler reads ICC_IAR1_EL1. That read is the acknowledge: it returns the INTID, moves the source to active, and raises the running priority to that source's priority. If nothing is pending it returns the spurious ID. The handler dispatches on the INTID, services the device, and writes the same INTID to ICC_EOIR1_EL1, which drops the priority and, if EOImode is 0, also deactivates. With EOImode set to 1 the handler additionally writes ICC_DIR_EL1 when it is genuinely finished.
The detail that catches people is that the specification requires the EOI to match the most recent acknowledge, and that acknowledges and EOIs nest strictly. Writing an ID you did not read, or writing them out of order across nesting levels, produces unpredictable behaviour rather than a graceful error. Hardware that maintains a running-priority stack cannot recover from a software error that unbalances it, and that is a general lesson about handshakes. If you keep a stack in hardware, the protocol has to make it impossible for software to unbalance it, or you have to detect and report the unbalance. Volunteering that observation is worth more than the register names.
3.4 Message-signalled interrupts, or why a wire became a memory write
Go back to 1.3 and the two hundred wires. Message-signalled interrupts are the answer that removes the wires entirely.
The device does not have an interrupt pin. When it wants attention it performs an ordinary memory write, a specific data value to a specific address, and that address happens to be decoded by the interrupt controller rather than by memory. The controller receives the write, converts the data into a pending interrupt, and proceeds exactly as before.
The consequences are large and mostly not about pins.
Numbers. PCI Express devices using MSI-X can each request up to 2048 distinct messages, against a limit of 32 for the older MSI capability, and against exactly one for a pin. A network card can therefore have a separate interrupt per receive queue per core, which is what makes multi-queue networking scale at all.
No sharing. The wired-OR problem from the end of 1.4 disappears. Each message is its own interrupt with its own handler, so no handler has to poll a chain of possible sources.
Ordering. This is the underrated one. An interrupt on a wire is signalled out of band, so it can arrive at the core before the data the device just DMA-wrote has become visible, and the handler reads stale memory. Drivers historically defended against this by reading a device register in the handler, which flushes the path by forcing a round trip. A message-signalled interrupt is a write on the same path as the data, so if the interconnect keeps writes in order, the interrupt cannot overtake the data it is announcing. That is a correctness property obtained by changing the signalling mechanism, and it is a satisfying thing to be able to explain.
Routing becomes addressing. Which core gets it is now encoded in the address and data the device was programmed with, so steering an interrupt is reprogramming a device's message, which is a table update rather than a wiring change.
The cost is that the controller now has to accept and decode writes at wire speed, and that the "interrupt" is a transaction subject to interconnect backpressure, so the controller must not be able to block the fabric when it is busy. That is a design constraint of the same family as any other slave that must always accept.
3.5 The ITS, and translating an identity into an interrupt
With messages, one more problem appears, and that is which device sent it. Any master can write any address, so if the message alone carried the interrupt number, any master could forge any interrupt. In a virtualised system, where a guest programs its own device, that is a security hole rather than a nuisance.
Arm's answer is the Interrupt Translation Service, the ITS, which sits in front of the redistributors. A device's write carries an EventID as data, and the interconnect independently supplies a DeviceID derived from who the requester actually is. For PCIe that comes from the requester identity, which the device cannot forge. The ITS then performs a table walk in memory. The DeviceID indexes a device table, which points to that device's interrupt translation table, which maps the EventID to an INTID in the LPI space and to a collection, and a collection table maps the collection to the redistributor that should receive it.
Three things make this worth understanding rather than memorising.
It is a translation, and therefore an isolation mechanism: a device can only raise interrupts that software has entered into its table, and it cannot see or affect another device's table. That is the same architectural move as the IOMMU in Part 5, applied to interrupts instead of addresses.
It is in memory, which is the only way to hold state for a hundred thousand interrupts. That means the ITS is a hardware table walker with caches, with all the invalidation and coherence obligations that implies. The ITS has an explicit command queue for software to invalidate and to move collections, precisely because moving an interrupt's target is now a cache-coherence problem rather than a register write.
The collection indirection is not redundancy. It exists so that migrating a virtual machine or a thread from one core to another can be done by re-mapping one collection rather than by rewriting every affected device's translation entries.
A fifth version of the GIC architecture has been published and Linux support for it was in progress in public kernel patches during 2025. If a conversation goes there, the honest position is to name the split of concerns you know from v3 and v4 and say you have not read v5 in detail rather than to improvise.
3.6 RISC-V, deliberately much smaller
RISC-V starts from a different place. The privileged architecture defines only a handful of interrupt causes visible to a hart: software, timer and external, each in machine and supervisor flavours, with pending and enable bits in mip/mie and sip/sie. Everything richer is pushed outside the core into platform hardware. That is a deliberate choice with a real cost and a real benefit, and it is a good thing to be able to argue both ways.
The CLINT is the small piece. It holds mtime, a single free-running 64-bit counter shared by the whole platform, one mtimecmp per hart, and one msip bit per hart. A timer interrupt is pending on a hart whenever mtime is greater than or equal to that hart's mtimecmp, compared as unsigned. Writing msip for a hart raises a software interrupt on it, which is the entire inter-processor interrupt mechanism.
Two properties of that design are worth noticing because they are consequences of extreme simplicity. The timer-pending bit in mip is read-only. You cannot clear a timer interrupt directly, you clear it by writing a new mtimecmp, which is a nice example of making an illegal state unrepresentable. And on a 32-bit hart, mtime and mtimecmp are two 32-bit accesses, so writing them naively can produce a spurious interrupt when the low word wraps between the two writes. The standard software sequence writes the low word to all ones first, then the high word, then the low word. That is a genuine hardware-software interface hazard produced by a register that is wider than the bus, and it generalises to every wide counter you will ever expose. The CLINT's exact register layout originated in vendor platform documentation and was later given a standardised form under the ACLINT specification. If you cite a document, cite the one your platform actually follows rather than assuming they are identical.
The PLIC handles everything else, the real device interrupts. Its model is deliberately flat. Each source has a priority register, where zero means "never interrupt". Each context, meaning a particular hart at a particular privilege level, has its own enable bit per source and its own threshold register. The PLIC signals the external-interrupt line to a context when some enabled source has priority strictly greater than that context's threshold. Note that the PLIC's convention runs the opposite way to the GIC's. Higher numbers are more urgent.
The handshake is two register accesses with a nice property. The handler reads the claim/complete register, which atomically returns the highest-priority pending enabled source ID and clears its pending bit, returning zero if there is nothing. When finished, the handler writes that same ID back to the same register, which is the completion signal that permits the source's gateway to forward another request. The atomicity of the read is what makes the PLIC safe when several cores are enabled for the same source: exactly one of them wins the claim, the others read zero and return. That is a hardware-provided mutual exclusion doing work that would otherwise require a lock, and it is a good detail to name.
What the PLIC deliberately does not do is preemption. There is no running-priority stack in the hardware. If software wants nesting, it raises the threshold register itself inside the handler and lowers it on exit, which is a two-instruction implementation of the mechanism the GIC builds in silicon. That is the RISC-V trade in miniature: less hardware, more software, and a specification you can read in an afternoon.
3.7 The AIA, RISC-V catching up on messages
The PLIC's flat model does not scale to a machine with hundreds of harts and virtualised devices: enable bits are per context per source, so the register file grows as the product, and there is no message path at all. The Advanced Interrupt Architecture replaces it with two blocks.
The APLIC handles wired interrupts and is organised into hierarchical domains, so a root domain can delegate a source down to a child domain. That is how machine level hands a device to supervisor level, or how a hypervisor hands one to a guest. It can operate in a direct mode, behaving like a better PLIC, or in an MSI mode where it converts an incoming wire into a message.
The IMSIC is a per-hart message receiver: the hart's own private controller for external interrupts, with separate interrupt files for machine level, supervisor level and each guest, each file occupying a small fixed region of physical address space and supporting a large number of interrupt identities. Because a guest's file is a distinct page of physical address space, a hypervisor can map it into the guest and let devices deliver interrupts to a running guest without any hypervisor involvement at all.
That last sentence is the point of the whole architecture and it is the same point as GICv4's direct injection. The expensive thing in a virtualised system is not delivering an interrupt, it is trapping to the hypervisor to deliver it, so both architectures eventually grew hardware whose only purpose is to let the interrupt reach the guest without a trap.
3.8 The comparison to have ready
| Arm GIC (v3/v4) | RISC-V CLINT + PLIC | RISC-V AIA | |
|---|---|---|---|
| Timers and IPIs | PPIs and SGIs, in the redistributor | CLINT: mtime, mtimecmp, msip | unchanged CLINT-style timer, IPIs by MSI |
| Device interrupts | SPIs through the distributor | PLIC, flat, per-context enables | APLIC, hierarchical domains |
| Messages | LPIs via the ITS | none | IMSIC per hart |
| Priority | per source, with running priority and preemption in hardware | per source, threshold per context, no hardware preemption | per source with priorities in the file |
| Acknowledge | read ICC_IAR1_EL1 | read claim/complete | read a per-file top-interrupt register |
| Completion | write EOI, optionally split into priority drop and deactivate | write the ID back to claim/complete | write to the file |
| Isolation of who may raise what | ITS translation keyed on a requester identity the device cannot forge | not addressed | guest interrupt files, per-guest address space |
Here is the sentence that ties it together. The GIC builds the policy into silicon and the PLIC leaves it to software, and both eventually had to add a translation layer for messages, because both ran into the same two walls, the number of interrupts and virtualisation.
04.Part 4, timers, and the problem that is harder than it looks
4.1 What software actually asks a timer for
Three things, and they are not the same requirement.
"Tell me when." Wake me in 5 milliseconds. That is a comparator against a running count, and the interrupt it produces is the OS tick, the network retransmit timeout, the watchdog kick.
"How long did that take." Read a count before and after. That is a monotonic, uniform-rate counter, and everything from a profiler to a video frame pacer to a database's latency histogram depends on it.
"What time is it, relative to what that other core thinks." That is the hard one, and it is the subject of 4.3.
The first requirement is naturally per core, because each core has its own next deadline. The second and third are naturally global, because a duration measured on one core and compared against a duration measured on another is meaningless unless the underlying count is the same count. That tension between per-core comparators and one global counter is why every serious timer architecture has exactly that shape.
4.2 One counter, many comparators
Arm's Generic Timer is the cleanest public statement of the pattern. There is a single system counter that increments at a fixed frequency, and every processing element can read it. CNTPCT_EL0 gives the physical count. Each element then has its own set of timers, each of which is a comparator against that count plus an enable and a mask, producing a private peripheral interrupt when the count reaches the programmed value. CNTP_CVAL_EL0 holds an absolute compare value. CNTP_TVAL_EL0 is a convenience view that behaves like a down-counter, which is what software usually wants when it is thinking "in 5 milliseconds."
Two details of that architecture are worth internalising because they are design decisions rather than facts.
The counter's frequency is fixed and is not the core clock. It must be, because a duration measured in counter ticks has to mean the same thing before and after a frequency change, and the core clock changes constantly under the DVFS of DVFS Droop and Thermal. So the counter runs from a stable reference in a domain of its own. What that frequency is has moved, and it is worth knowing that it moved rather than quoting the old figure. Earlier Armv8 systems commonly ran the counter in the low tens of megahertz, and Armv8.6-A and later require the count to advance at an effective 1 GHz, so that one unit of the count is one nanosecond. Effective is the load-bearing word. An implementation is permitted to satisfy it by incrementing in larger steps at a much lower physical update rate, incrementing by 20 at 50 MHz rather than by 1 at a gigahertz, so the always-on power cost of the next paragraph does not scale with the architected rate. CNTFRQ_EL0 reports the frequency, and the architecturally interesting part is that hardware does not populate it. Firmware writes it during early initialisation. That is a deliberate choice to keep the value out of the silicon, and it means a firmware bug produces a system whose sense of time is wrong by a constant factor, with every timeout in the operating system scaled accordingly. It is a spectacular class of bug and a good example of a hardware-firmware contract that has no hardware enforcement.
The counter must not stop. If a core powers down, the counter must keep running, or the machine loses time across idle. So it lives in the always-on domain of Part 7 of Power Fundamentals and Clock Gating, which is precisely the domain a power-management block owns. That is the first of several places in this note where debug, RAS and timer infrastructure all turn out to need the same always-on, always-clocked island. It is also why one family of roles treats power, clocks, resets, debug and special-purpose registers as a single design area.
RISC-V says the same thing in fewer words: one mtime, one mtimecmp per hart, timer interrupt when the count reaches the compare value.
4.3 Why synchronising a counter across a die is genuinely hard
Here is the part that sounds like it should be trivial and is not.
The requirement is easy to state. Two cores read the counter. Their readings must be consistent with a single global timeline. If core A reads the counter, sends a message to core B, and B then reads the counter, B's value must not be smaller than A's. Software depends on this constantly and silently, in every "start time, end time, subtract" in every profiler, in every distributed trace, and in every lock-free algorithm that timestamps.
Now the physics. Take a large system-on-chip, 15 millimetres on a side. A signal in on-chip interconnect travels well under the speed of light in vacuum. A useful working figure for a repeated global wire is in the region of a few hundred picoseconds per millimetre once repeaters are counted, so crossing the die takes on the order of a few nanoseconds. The counter is one physical piece of logic somewhere on that die. Its value cannot be present in two places at the same instant, because there is no such thing as the same instant across a die.
So the counter's value has to be distributed, and distribution is where the difficulty lives. Take a counter whose physical update rate is 50 MHz, so it changes once every 20 nanoseconds, and a 3 nanosecond flight time from the counter to the far corner. That is 15 percent of a tick and looks harmless. But the value also has to cross into each core's clock domain, and that crossing is the synchroniser of Clocking Reset and Domain Crossing, which costs two or three destination-clock cycles of uncertainty. At a core running at 500 MHz that is 4 to 6 nanoseconds of uncertainty on top. At a core that has been clock-gated and is just waking, it can be more. If two cores' synchronisers happen to land on opposite sides of a tick boundary, they will report values one tick apart for the same real instant.
Work the failure concretely. Core A, at , reads 1,000,000. It writes a record into a shared queue and sends an IPI. Core B, at ns of real time, two full ticks later, reads its own view of the counter and gets 1,000,001, because its distribution path is one tick behind. Software computes the elapsed time as tick ns, which is wrong by a factor of two but harmless. Now run it the other way, with A on the lagging path. A reads 1,000,000 at real time 0, B reads 1,000,000 at real time 40 ns, and elapsed is zero. Worse still, with a bigger skew or a shorter interval, B reads a smaller number than A, and the elapsed time is negative. Software that subtracts two unsigned counters and gets a huge positive number because of the wrap is a real and well-known bug family, and it originates here.
Multiply the difficulty by four more effects and the reason this is hard becomes clear.
A core that was powered off. Its copy of the distributed count has to be re-established on wake, and until it is, its readings are garbage. So there is a defined sequence for bringing a core's timer view up, and a window in which it must not be used.
Multiple dies or sockets. Now the distribution crosses a package boundary with a much larger and much more variable delay, and there is no shared clock at all. Systems that need cross-socket timestamp coherence generally do it by a defined synchronisation protocol at boot plus periodic correction, not by broadcasting a value continuously.
Virtualisation. A guest that migrates between machines must see a monotonic counter, so the architecture provides a virtual count formed as the physical count minus a per-guest offset. That is a whole additional register and a whole additional class of bug.
Power. Toggling a 56- or 64-bit counter value across a chip-wide distribution network at tens of megahertz is real switching power on a network that never idles, which is exactly the always-toggling clock-tree situation from Part 2 of Power Fundamentals and Clock Gating. Real implementations therefore distribute increments or narrow encodings rather than the full value, at the cost of every receiver needing its own local counter to be initialised correctly and never to lose an increment. Losing one increment on one core is a permanent one-tick offset on that core that no amount of software can detect.
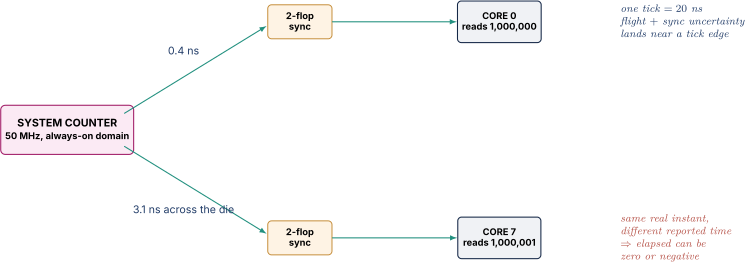
The mature summary is this. Timer synchronisation is hard because a counter is a single logical value that must be observed identically by physically separated observers in different clock domains and different power states, and none of those observers can be given the value instantaneously. The architecture makes the guarantee an explicit requirement, the implementation earns it with careful distribution and a defined initialisation sequence, and the failure mode is a small constant offset that no software test will find because nothing is ever wrong by much.
4.4 Watchdogs, which are timers with a different job
A watchdog is a counter that resets the system when it reaches its limit, and whose limit software must keep pushing away. It is the last line of defence against software that has stopped making progress in a way no other mechanism can detect.
Two refinements separate a real watchdog from a naive one, and both come up in the safety context of Part 9.
A window watchdog rejects kicks that are too early as well as too late. A stuck task in a tight loop that happens to contain the kick will service a simple watchdog forever. Requiring the kick to fall inside a window catches it.
A two-stage watchdog fires an interrupt first and a reset only if that interrupt does not lead to a kick. The interrupt gives a chance to capture which handler was running, what the queues looked like, and what the trace buffer holds, before the reset destroys the evidence. That is a serviceability feature in the sense of Part 8, and a watchdog without it converts every hang into a reboot with no information, which is the worst possible outcome for a field failure.
05.Part 5, the IOMMU, in one page
Virtual Memory and Memory Ordering covers translation and SoC Integration and Interfaces covers the integration surface, so this is deliberately short: what is different when the thing being translated for is a device rather than a core.
5.1 What DMA breaks
A core's memory accesses go through its MMU, so a process cannot touch memory it was not given. A DMA-capable device's accesses do not, historically, go through anything: the driver hands the device a physical address and the device writes there. Three problems follow.
Safety. A driver bug that hands the device a wrong address corrupts unrelated memory, with no fault and no attribution. It is the same class of failure as a wild pointer, except the fault is delivered by a bus master with no notion of the process that caused it.
Security. A device that can be programmed by an untrusted party, whether that is a guest driving its assigned device, an external port, or a compromised peripheral, can read or write all of memory. That is a complete bypass of every protection above it.
Usability. Physically contiguous buffers are hard to allocate. Without translation, a device that cannot walk a scatter list needs contiguity that the operating system may not be able to provide.
5.2 Stream identity, and two stages
The IOMMU, which Arm calls the SMMU or System Memory Management Unit, sits between the devices and the interconnect and translates their addresses before they reach memory. Everything in it follows from one requirement. It must be able to tell which device made the request, because different devices need different translations.
That identity is the StreamID, supplied by the fabric rather than by the device, derived for PCIe from the requester identity. It indexes a stream table whose entry describes how to translate that device's traffic. A finer identity called the SubstreamID, the PCIe PASID, distinguishes different address spaces belonging to the same device, which is what lets an accelerator work directly in several user processes' virtual address spaces at once.
Translation is in two stages for the same reason it is on the core side: stage 1 is the operating system's or the process's mapping, stage 2 is the hypervisor's. A guest may own stage 1 for its assigned device while the hypervisor owns stage 2, and the guest cannot escape stage 2 no matter what it programs. That is the mechanism that makes device assignment to virtual machines safe, and it is exactly parallel to the ITS translating interrupts in 3.5. Both exist so that a device controlled by an untrusted party cannot reach outside what it was given.
5.3 What a designer inherits
Three costs, all of which have direct analogues in the core-side material.
A TLB you now have twice. The SMMU caches translations, so it has all the invalidation obligations of a core TLB, and invalidations must be broadcast to it. A TLB shootdown now includes the IOMMU, which lengthens the operation and puts the IOMMU on the critical path of an operating-system primitive.
Latency in front of a device that expected none. A translation miss means a page-table walk before the DMA can proceed, so a device that assumed a fixed memory latency now sees a long tail. Devices with shallow buffers underrun. This is the same tail-latency argument as the display client in DRAM Controllers JEDEC and DFI, arriving from a different direction.
Faults from a context that no longer exists. When a translation fails, the fault has to be reported with enough context for software to attribute it, which means StreamID, SubstreamID, address and access type, and the offending transaction has to be terminated or stalled in a way the device can survive. Getting fault reporting right is unglamorous and is the difference between a debuggable system and one where "something DMA'd somewhere" is all anybody ever learns.
06.Part 6, external debug
6.1 Debug is a second machine that must work when the first one does not
DFT and Silicon Debug Part 8 covers the observability you build into your own block: trace buffers, triggers, observability muxes, performance counters. This Part covers the standardised, architected mechanism by which an external tool takes control of a core, and it starts from one requirement that determines everything else.
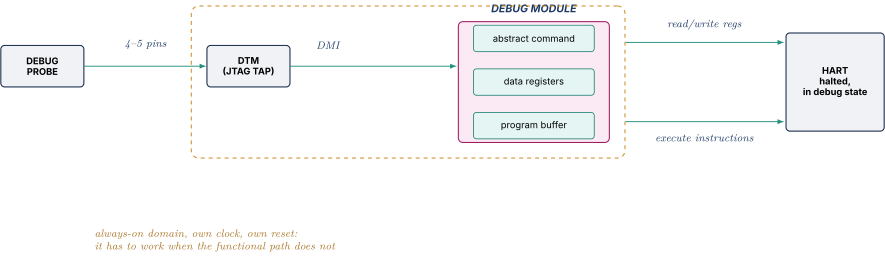
The debug machinery must work when the core is broken. If the core has hung on a deadlocked bus transaction, or is spinning at an exception level you cannot reach, or has stopped fetching because its clock stopped, the debugger still has to get in and read state. That single requirement forces four architectural properties, and naming them is the best possible answer to "why is debug a separate subsystem":
- A separate access path that does not use the core's own load/store unit or the main interconnect, because those may be exactly what is broken.
- A separate clock, because the functional clock may be stopped or may be the problem.
- A separate power domain, always on, because the core's domain may be gated. This is the same always-on island as the timer in 4.2 and the trigger configuration registers in DFT and Silicon Debug 8.3.
- A separate reset, so that resetting the core does not reset the debug logic and lose the connection, and so that a debugger can hold a core in reset and attach before the first instruction executes, which is how you debug a boot failure.
That list is worth memorising in that shape, because it is a complete answer that reasons from the requirement rather than reciting a block diagram.
6.2 Halt, step, resume
The three primitives.
Halt stops the core in a state where all of its architectural state is readable and writable, without destroying it. It is not a reset and not an exception in the normal sense: the core enters a distinct debug state, and while there it is not executing the program.
Two subtleties make halt harder than it looks.
The halt has to be precise enough to be useful. A deeply pipelined out-of-order core has dozens of instructions in flight. Halting means letting the ones that must complete complete, discarding the speculative ones, and arriving at a defined architectural boundary, so that the state you read corresponds to a specific point in the program. That is the same machinery the core already has for taking a precise exception, which is why halt is usually built on it.
A halted core must still respond to the rest of the machine. This is the detail interviewers use to separate people who have thought about it. If core 0 halts while it holds a cache line in a modified state, and core 1 then requests that line, core 0 must still service the snoop or core 1 hangs and you have converted a debug session into a system-wide deadlock. So the coherence and snoop logic must remain live in debug state, even though the pipeline is not fetching. The same is true for any outstanding transaction that must be completed, for the interrupt controller's state, and for anything else that another agent is waiting on. Debug halt is therefore not "stop the clock", it is "stop the instruction stream while remaining a good citizen of the system."
Step executes exactly one instruction and returns to debug state. It sounds like a small variation on resume and it is a nuisance in practice, because "one instruction" has to be defined in the presence of interrupts (does an interrupt taken during the step count?), of instructions that are themselves interruptible, and of the debugger's own injected instructions.
Resume returns the core to the program. The hard part is doing it without perturbing anything the debugger touched, which is why the debug logic saves and restores the state it clobbers.
6.3 Breakpoints and watchpoints, and the honest limitation of one of them
A breakpoint stops the core when it is about to execute a particular instruction. Two implementations, with different properties.
A software breakpoint replaces the instruction in memory with a dedicated trapping instruction and restores it when removed. That instruction is BRK in AArch64, BKPT in the older A32 and T32 instruction sets, and EBREAK on RISC-V. Unlimited in number, costs no hardware, and requires the memory to be writable, so it is useless for code in ROM or in a read-only mapping, and it perturbs the instruction cache and any checksum over the code.
A hardware breakpoint is a comparator on the instruction address, so nothing in memory is modified. It works in ROM, works on self-modifying code, and is limited in number by the comparators you built. A handful is typical, and the exact count is implementation-defined in both Arm and RISC-V. Every extra comparator sits on the fetch path and costs timing there, so the count is a real PPA decision rather than an arbitrary limit.
A watchpoint is the same idea on data: stop when a particular address is read or written. Usually specified as an address plus a mask plus a size plus a direction, so a watchpoint can cover a range and can distinguish loads from stores. And here is the limitation to volunteer rather than to be caught by: on an out-of-order core, watchpoints are often imprecise. The store that triggered it retired, the pipeline continued, and by the time the core is halted the reported program counter may be several instructions past the access. Software developers experience this as "the debugger stopped in the wrong place", and it is not a bug in the debugger. Making watchpoints precise costs the same machinery as making exceptions precise for a class of events that is rare and inserted only during debugging, so implementations often decline, and the specification says so.
RISC-V standardises this whole area as the trigger module, a small array of trigger registers each of which can be configured as an instruction-address match, a data-address or data-value match, an instruction-count trigger, or an exception trigger, and each of which can be programmed to halt into debug mode, to take a trap, or to start or stop trace. Unifying breakpoints, watchpoints and trace control into one programmable array is a cleaner factoring than treating them as three separate features, and it is worth naming as an example of good architecture rather than merely as a fact.
6.4 How the debugger physically gets in
JTAG is the traditional path and its TAP state machine is already covered in DFT and Silicon Debug Part 6.2, so the only thing to add here is what it is being used for in this context. Boundary scan was the original purpose. The modern purpose is as a general-purpose serial access port to on-chip debug registers. The TAP shifts an instruction that selects a debug register, then shifts data in and out of it. It is slow, a few tens of megahertz at one bit per clock, but it needs no functional logic to be working, which is exactly the property 6.1 demanded.
A two-wire alternative exists because four or five pins is a lot on a small package. Arm's Serial Wire Debug uses a clock and a single bidirectional data line, with a packet protocol carrying a start bit, a read/write and address field, parity, and defined turnaround periods where neither end drives. The bidirectional line is what buys the pin saving and is also what makes the protocol fussier: both ends must agree exactly on when the line changes direction, and a turnaround error looks like corruption rather than like a protocol error. The pin count is the entire justification, and on a package where every pin is contested that is justification enough.
RISC-V's structure separates the two concerns cleanly, and the separation is instructive. The Debug Transport Module is whatever gets bits onto the chip, a JTAG TAP or something else entirely. It is the manager of a small internal bus, the Debug Module Interface, whose address space is a handful of address bits wide. On that bus sit one or more Debug Modules, each controlling a set of harts. Swapping JTAG for a different transport therefore changes only the DTM, and the DM and everything above it are untouched. That is a clean interface boundary in exactly the sense of SoC Integration and Interfaces, and it is worth pointing at as an example of a specification that separated transport from function on purpose.
6.5 The RISC-V Debug Module, and a genuinely elegant idea
The Debug Module has to let a debugger read and write every register and every memory location of a halted hart. The naive implementation builds a datapath from the DM to every architectural register in the core, which is a lot of wires into a place where wires are expensive, and it has to be extended every time the ISA adds state.
The specification provides two mechanisms instead, and the pairing is the interesting part.
Abstract commands are a small fixed set of operations the DM performs directly. The debugger writes a command register describing, for example, "read general-purpose register 12", and the DM performs it and leaves the result in a data register. Access to the general-purpose registers is the baseline capability, and implementations may support more. This is the fast, simple path for the operations that happen constantly.
The program buffer is the escape hatch, and it is the elegant part. It is a few words of writable storage from which the halted hart can be made to execute instructions. The debugger writes a short instruction sequence into it, the DM makes the hart execute it and then re-enter debug state, and the result is left in a data register. Because the hart is executing real instructions with its own datapath, anything the ISA can do, the debugger can now do: read a control and status register, perform a load or a store to inspect memory, read a floating-point register, execute a fence.
The trade is worth stating in general terms because it recurs everywhere in hardware design. A fixed-function unit is fast, simple and complete only for what you anticipated. Borrowing the machine's own general-purpose datapath is slower per operation but covers everything, including what you did not anticipate, for almost no extra hardware. The DM gets a tiny implementation and unlimited capability by making the core do the work. A third option also exists. A system bus access block in the DM reads and writes memory directly without involving the hart at all, which is what you want when the hart is too broken to execute anything, or when you want to inspect memory without halting.
6.6 Self-hosted debug, and why it is a different feature
Everything above is external debug, where a probe halts the core from outside. There is a second mode, self-hosted debug, in which the same comparators generate exceptions that the software on the machine handles itself. That is what a debugger running on the same operating system as the program uses. gdb attached to a process on a running Linux system is using self-hosted mechanisms, not a JTAG probe.
The hardware is largely shared. What differs is where the event is delivered and who is allowed to configure it. That immediately creates a permission question. A program must not be able to set a watchpoint on another program's memory or halt the whole machine, so breakpoint and watchpoint resources are architected with an exception-level or privilege-level scope, and the operating system context-switches them. A designer's takeaway is that these comparators are per-context architectural state, which means they get saved and restored on every context switch, which means their number has a direct cost on context-switch time.
6.7 Debug is a security hole unless it is locked
A mechanism that reads all state and executes arbitrary instructions is, from a security perspective, the most powerful attack surface on the chip. Security Side Channels and Speculation holds the broader argument. The debug-specific answer has three layers.
Authentication signals. Arm architects a set of signals that gate whether invasive and non-invasive debug are permitted, and whether they are permitted in secure state. Conventionally those signals are DBGEN, NIDEN, SPIDEN and SPNIDEN. They are inputs to the core, driven by something on the chip that decides policy, whether fuses, a security controller, or a boot-time decision.
Fusing. A production part typically has debug permanently disabled by blowing a fuse, which is irreversible and therefore a manufacturing decision with no take-backs. That is why there is always tension between the security team, who want it fused, and the failure-analysis team, who need it to diagnose returned units.
Authenticated unlock. The compromise that resolves that tension: the debug port is disabled until a challenge-response exchange against a key held by the vendor succeeds, so returned parts can be opened by the vendor and by nobody else. It is more hardware and more process, and it is what a product that expects field failures actually wants.
The point to make in an interview is that debug access control is a product decision expressed in silicon, and the designer's job is to make all three positions implementable rather than to pick one.
07.Part 7, trace, and the bandwidth problem that defines it
7.1 Trace is not debug
Debug stops the machine and looks at it. That is fine for a program that fails deterministically at a known place, and it is useless for the failures that matter most: a race that only occurs at full speed, a real-time deadline missed once an hour, a performance anomaly, a bug that vanishes when you slow anything down. For those you need a record of what the machine did while it kept running, which is trace.
The two are complementary and the distinction is worth being crisp about, because it comes up as a question. Debug is intrusive and interactive. Trace is non-intrusive and post-mortem. Trace changes nothing about the program's timing if it is done properly, and it produces a stream you analyse afterwards.
It is also where the reader's existing home-grown work sits. DFT and Silicon Debug Part 8 covers trace buffers you build for your own block, the triggers that decide when to record, and the arithmetic showing that the trigger matters far more than the buffer depth. Everything here is the standardised, architected, processor-level version of that, and it has one problem the block-level version does not: the volume is enormous.
7.2 The arithmetic, which is the entire subject
Do the naive calculation and the conclusion is unavoidable.
Take one 4-wide superscalar core at 3 GHz sustaining an IPC of 2.0, which is a reasonable figure for good general-purpose code. That is
Record the program counter of each retired instruction. A 64-bit address is 8 bytes, so the raw rate is
Forty-eight gigabytes per second, from one core, to record nothing but where it was. Now price the places that number could go.
Off the chip. A parallel trace port is a handful of pins clocked at some rate, and public implementations commonly use between 4 and 32 data pins, at speeds that put a wide, fast port in the low single-digit gigabytes per second at best. High-speed serial trace links do better. Either way you are one to two orders of magnitude short, and every one of those pins is a pin the product would rather spend on something a customer can use.
On the chip. An embedded trace buffer of 1 MB is already a large SRAM, comparable to a slice of last-level cache, and therefore competing directly with performance the customer can measure. It holds
Twenty-one microseconds of history. The bug you are chasing happened four milliseconds ago.
To main memory. Routing trace into DRAM through a trace-memory sink gives you capacity, and it costs 48 GB/s of memory bandwidth against a channel that, from DRAM Controllers JEDEC and DFI, might have 25.6 GB/s of peak in total. You cannot pay it, and even if you could, the act of paying it changes the timing of the program you are trying to observe, which destroys the one property that made trace worth having.
And that was one core. Eight cores is 384 GB/s.
So say the conclusion in the form that shows you understand the discipline. Compression is not an optimisation applied to trace. Compression is the reason trace can exist at all. Any answer to "how would you build instruction trace" that does not start with the bandwidth arithmetic has missed the problem.
7.3 Branch-trace compression, derived rather than quoted
The key observation is almost embarrassingly simple once stated, and everything follows from it.
The decoder already has the program. The host that will analyse the trace has the binary. It can read the instructions. So the hardware does not need to send anything the host can work out for itself. The only information the host cannot derive is the outcome of choices the hardware made.
Walk the instruction stream and ask, for each instruction, whether the host could have predicted the next program counter from the binary alone.
An arithmetic or load or store instruction at address of length is followed by the instruction at . The host knows from the binary. Nothing needs to be transmitted.
An unconditional direct branch, such as jal or b label, has its target encoded in the instruction itself. The host reads the instruction and knows exactly where control went. Nothing needs to be transmitted.
A conditional direct branch has its target in the instruction, so the only unknown is whether it was taken. That is one bit.
An indirect branch, meaning a return, a call through a function pointer, a virtual dispatch, or a jump table, has a target the host cannot know, because it is a runtime value. The target address must be transmitted, though usually as a difference from the previous address rather than in full.
An exception or interrupt is asynchronous. The host has no way to know where in the instruction stream it happened, or where control went. Both the point and the destination must be transmitted.
Now redo the arithmetic under that scheme. Take a conditional branch every 5 instructions, which is a standard figure for general-purpose code, and ignore for a moment everything else.
From 48 GB/s to 150 MB/s. A factor of 320, obtained not by a clever encoder but by noticing that the receiver already has the program. Per instruction, that idealised figure is bits. Real encoders land worse than that once indirect branches, exceptions, synchronisation and timestamps are counted, and figures around or a little under one bit per instruction are what public material on real instruction-trace encoders tends to describe. Treat the 0.2 as the floor the mechanism implies and the ~1 as the engineering reality, and say so that way rather than quoting either as fact.
Two further compressions are standard and both are worth naming because they show you have thought past the basic idea.
Aggregating branch outcomes. Rather than one packet per branch, accumulate outcomes into a bit vector and emit a packet when it fills. That amortises the per-packet overhead, which would otherwise dominate: a two-byte packet carrying one bit is not one bit.
A return address stack inside the encoder. Most indirect branches are returns, and most returns go to the instruction after the matching call, which the host can compute. So the encoder keeps its own small return-address stack, exactly the structure from Front End and Branch Prediction, and when a return goes where the stack predicted, it emits a single bit instead of an address. The acronym collision is worth naming out loud since it is about to bite. In Front End and Branch Prediction and in the rest of these notes RAS means return address stack, and from Part 8 of this note onward RAS means reliability, availability, serviceability. They are unrelated, both are standard, and the only defence is context.
7.4 What still has to be sent, and why the stream is lossy on purpose
Four categories survive compression, and each has a design consequence.
Synchronisation packets. A decoder must be able to start decoding in the middle of a stream, because a circular buffer's oldest content is a partial packet and because trace is often captured from an arbitrary moment. So the encoder periodically emits a full absolute program counter and full context, at a configurable interval. That interval is a direct trade: frequent sync costs bandwidth, infrequent sync means a longer unusable prefix after you start decoding and a longer recovery after an error.
Context changes. An address is meaningless without knowing which address space it is in. So a change of address-space identifier, virtual-machine identifier, privilege level or security state must be emitted, or the host will decode kernel addresses against a user binary and produce confident nonsense.
Timestamps. Discussed in 7.9. They are the largest optional cost in the stream.
Overflow markers. And this is the honest one. The encoder produces bursts. The sink drains at a fixed rate. A FIFO sits between them. When a branchy loop or an interrupt storm produces more trace than the sink can absorb, the FIFO fills. The encoder then has exactly two options. It can stall the processor, which is intrusive and destroys the timing you were trying to observe, or it can drop trace and mark the gap so the decoder knows to resynchronise at the next sync packet.
Real trace overwhelmingly chooses to drop. That is the design decision to be able to defend. Trace is lossy by construction, because the alternative is to perturb the thing being measured. A configurable stall option usually exists for the cases where completeness matters more than fidelity, and choosing it means accepting that the bug you were chasing may not reproduce.
7.5 Data trace, and why it is mostly not offered
Instruction trace answers "where did it go". Data trace answers "what values did it touch", and it is far more valuable for a data-corruption bug, and far less often implemented.
The reason is the arithmetic again. Nothing about a data value is derivable from the binary, so every traced access costs an address and a value. Call it 8 to 12 bytes with no compression available beyond address differencing. If a third of instructions are loads or stores, that is accesses per second at 8 bytes, or 16 GB/s, right back where we started. The only way data trace is usable is heavily filtered, down to a small address range, one variable, or one peripheral's registers, which requires comparators on the load/store path, which cost timing exactly where you can least afford it.
The mature summary is that data trace is a per-design decision with a real cost, that it is normally scoped by address filters, and that its absence is why software instrumentation exists: a dedicated instrumentation source into which software writes short messages is far cheaper than tracing all data, and puts the choice of what matters in the programmer's hands. CoreSight standardises exactly such a source.
7.6 CoreSight, and the source-link-sink structure
Arm's CoreSight is the standardised, discoverable version of everything above, and its structure generalises well beyond Arm, so learn the shape rather than the part numbers.
Sources produce trace. An ETM or equivalent trace unit attached to a core produces instruction trace, and data trace where implemented. A system trace macrocell provides the software-instrumentation channel of 7.5: software writes to a memory-mapped port and the write becomes a timestamped trace packet, with many independent channels so that different subsystems do not interleave incomprehensibly.
Links move and merge trace. Everything travels on a trace bus with a trace ID identifying its source, which is what makes merging reversible. A funnel merges several streams into one, arbitrating between them. A replicator does the opposite, copying one stream to two destinations so you can capture on chip and export off chip at the same time. A configurable trace-memory block can act as a small FIFO in the middle of the topology to absorb bursts.
Sinks are where trace ends up. An on-chip buffer holds it in dedicated SRAM. A router variant writes it into system memory over the main interconnect, which trades bandwidth for capacity. A trace port unit drives it off-chip over pins to a probe with, effectively, unlimited capacity and very limited bandwidth.
Two structural features are as important as the components. There is a discovery mechanism, a table in memory-mapped space that a tool reads to find every component, its type and its address, so that a debugger can attach to a chip it has never seen and enumerate the trace topology. And there is an authentication interface, the same signals as 6.7, so that trace can be disabled on production parts independently of interactive debug. Trace is non-invasive, so a product may reasonably permit it while forbidding halting, or forbid both.
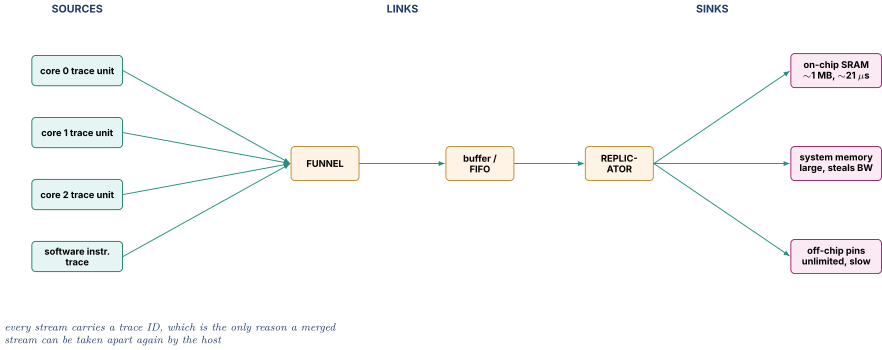
7.7 RISC-V processor trace
RISC-V standardised the same ideas later and, characteristically, in more than one document, so be precise about which.
There are two encoder specifications. Efficient Trace for RISC-V, usually shortened to E-Trace, defines instruction trace built on exactly the branch-compression argument of 7.3, together with the ingress port, the signal bundle the core presents to the encoder each cycle describing what retired. Standardising the ingress port is the clever part, because it means a trace encoder can be an independently designed piece of IP attached to any compliant core. N-Trace is the Nexus-based alternative, aligned with the IEEE-ISTO 5001 Nexus message classes, and it defines two instruction-trace modes. Branch trace messaging has each taken branch produce a short message with repeat counts. History trace messaging has each conditional branch contribute a single bit to a history buffer that is emitted when it fills, which is the aggregation idea of 7.3 as a named mode.
On top of both sits a common trace control interface, so that tools can configure either family the same way. Version numbers move. At the time these sources were checked, E-Trace was at version 2.0 and N-Trace at 1.0.0, and the right posture in an interview is to name the mechanism confidently and the version tentatively.
7.8 Cross-triggering, and why a trigger bus needs a documented latency
DFT and Silicon Debug 8.3 introduces triggers within a block. The system problem is that the block that detects the interesting event is rarely the block whose behaviour you need to capture. The interconnect notices a protocol violation. You want the core's last thousand instructions. The core hits a watchpoint. You want every other core halted in the same instant so the shared data structure is frozen.
So there is a chip-wide cross-trigger network: a per-block interface exposing that block's trigger inputs and outputs, and a matrix that routes any output to any set of inputs. Standard uses are halting all cores when one halts, starting trace when a watchpoint fires, stopping trace when an error is detected so the buffer holds the run-up rather than the aftermath, and letting an external probe inject a trigger through the debug port.
The design constraint worth volunteering is latency, and specifically that it must be documented rather than merely small. A trigger takes some number of cycles to cross the chip and cross clock domains. If core 0 halts at cycle and core 1 receives the trigger at cycle , then core 1 executed forty more cycles, and the "simultaneous" snapshot is not simultaneous. That is tolerable if the number is specified, because the analysis can account for it. It is intolerable if it is unknown or variable, because then you cannot tell whether an apparent ordering in your captured data is real. A cross-trigger network with an unspecified latency produces evidence you cannot reason about, which is worse than no evidence.
7.9 Timestamps, and the multi-core correlation problem
Eight cores, eight encoders, eight independent streams, each buffered separately and merged through a funnel that arbitrates between them. Ask the obvious question. Does the order of packets in the merged stream tell you the order in which the events happened?
No, and the reasons stack up. Each encoder has its own FIFO with its own occupancy, so a packet from a core whose FIFO was nearly full is delayed relative to a packet from a core whose FIFO was empty. The funnel arbitrates, and arbitration is not order-preserving across inputs. Encoders compress adaptively, so a burst of activity is emitted later than a quiet period's packets that logically follow it. And the cores may be at different frequencies, so "cycles" do not even mean the same duration.
The only fix is a common time base injected into every stream. A timestamp generator broadcasts a value, each encoder inserts it into its own stream periodically, and the host uses those anchors to interleave the streams. That is exactly the system counter of Part 4, and it inherits every one of Part 4.3's difficulties, the distribution delay, the domain-crossing uncertainty, and the cores that were powered down.
And then the honest limitation, which is the mature part of the answer. Timestamps are expensive, so they are inserted at intervals rather than on every packet. Between two timestamps, the ordering within a stream is exact and the ordering across streams is unknown. So the resolution of cross-core correlation is the timestamp interval, not the cycle. Turning the interval down improves resolution and costs bandwidth on the resource that was already the constraint, which puts you back in 7.2.
If you need finer causality than the timestamp interval provides, timestamps will not give it to you and you must design it in: a cross-trigger with a documented latency to mark a common instant in every stream, or a global sequence number carried in the transactions themselves so that the data establishes the order rather than the timing. That last technique is the one to reach for, because it converts a timing problem into a data problem, and data survives buffering.
08.Part 8, RAS, reliability, availability, serviceability
First, the collision. Everywhere else in these notes RAS is the return address stack of Front End and Branch Prediction. For the rest of this note it is reliability, availability, serviceability, an entirely unrelated term of art originating in mainframe engineering and now standard across server, automotive and mobile silicon. Both are ubiquitous. If an interviewer says RAS and the context is a server or a memory subsystem, they mean this one.
8.1 The three words, separately and with numbers
They are routinely said as one word and they are three different properties with three different design responses.
Reliability is the probability that the system operates without failure over a period. Its natural unit is the FIT, one failure per device-hours. A component rated at 100 FIT fails, on average, once per hours, which is once per 1,140 years.
That sounds like a solved problem until you multiply. Take a fleet of 50,000 servers, two sockets each, so 100,000 sockets, each at 100 FIT:
which is about one every four days, from the sockets alone, ignoring DRAM, storage, power supplies and network. Add DRAM at a realistic per-device rate across hundreds of thousands of devices and the fleet-level rate rises well past one per hour. Reliability engineering at scale is not about making one part good, it is about the arithmetic of large numbers, and that is why hyperscalers and mainframe vendors converged on the same techniques from opposite directions.
Availability is the fraction of time the system is usable, and the formula is where the insight lives:
Work it. A machine with a mean time between failures of 10,000 hours and a mean time to repair of 4 hours has
which is 3.5 hours of downtime per year. Now improve it two different ways.
Double the MTBF to 20,000 hours, which is an enormous, expensive, multi-year engineering effort:
and downtime halves, to 1.75 hours per year.
Or leave the MTBF exactly where it was and cut the MTTR from 4 hours to 4 minutes, by making the failure detectable, attributable to a specific field-replaceable unit, and recoverable by restarting one process instead of the machine. Four minutes is hours, so
which is hours, or 3.5 minutes of downtime per year.
That comparison is the single most important idea in this Part. Reducing repair time improved availability sixty times more than doubling the reliability, and it was far cheaper. Availability is not reliability. A system that fails often and recovers instantly can be more available than one that fails rarely and takes a day to fix.
Serviceability is what makes that repair time small. It is the ability to detect the failure, identify precisely what failed, and replace or work around it with minimal disruption. Concretely, it is error logs that name the failing memory module rather than reporting "a memory error". It is counters that let software retire a page before it produces an uncorrectable error. It is hot-swap, the ability to take a core offline without rebooting, and a first-error record that survives the cascade. It is the least glamorous of the three, it is the one hardware designers most often treat as an afterthought, and by the arithmetic above it is the one with the best return.
Say them together in one sentence and the structure is clear. Reliability is how often it breaks, availability is how much of the time it is working, and serviceability is how fast you can tell what broke and get back. Serviceability is usually the cheapest way to buy availability.
8.2 The error taxonomy, as a two-by-two
Every hardware error falls somewhere in a grid with two axes: was it detected, and was it corrected. The grid is the taxonomy and each box has a name, a response, and a cost.
| Corrected | Not corrected | |
|---|---|---|
| Detected | CE, a correctable error. ECC fixed it. Log it, count it, continue. Costs nothing but a log entry and predicts the future. | UE / DE, the value is known bad. Now the design has a choice: raise an error now, or defer it by poisoning the value and raising only when someone consumes it. |
| Not detected | (empty by construction, you cannot correct what you did not detect) | SDC, silent data corruption. The machine computed the wrong answer and told nobody. |
Two refinements matter within the uncorrected-and-detected box, and Arm's RAS architecture gives them names worth borrowing because they map onto what the hardware must do.
A deferred error is bad data that has been marked and has not yet been consumed. Nobody has to die yet.
An uncorrected error splits by how much is still trustworthy. If the error is recoverable, the affected context is known, meaning this instruction and this process, and killing that context is sufficient. If it is unrecoverable or uncontainable, the corruption's extent is unknown, which means machine state cannot be trusted and the only safe response is to stop. The whole engineering effort in RAS is to move errors up that ladder, from uncontainable to recoverable, from recoverable to deferred, and from deferred to corrected.
8.3 Silent data corruption, and why it is the one that frightens people
The empty-of-defences box is the bottom right. The machine produced a wrong answer, no ECC fired, no exception was raised, no counter incremented. The wrong answer was written to a database, checksummed, replicated to three sites, and served to users.
Two industrial papers changed how this is discussed. Google's Cores that don't count (HotOS 2021) and Meta's work on silent data corruption at scale both report the same phenomenon from fleets of hundreds of thousands of machines. A small number of individual cores, which the papers call mercurial, compute incorrect results occasionally, while the rest of the same chip is fine. The properties that make them terrifying are all in the reports and all worth knowing:
They are per-core, not per-chip, so a chip is not simply good or bad.
They are data-dependent and intermittent, appearing for particular operand patterns or particular instruction sequences, so they pass every general test and fail on one workload.
They appear after burn-in and after deployment, so manufacturing test did not catch them and could not have, which connects directly to the wear-out mechanisms of Reliability Aging and Variation.
They are sensitive to voltage, frequency and temperature, so they may vanish at the operating point you use to debug them.
The design consequences are what an interview will probe. Memory ECC does not help, because the corruption is in the compute, not in storage. Adding ECC to more arrays does not help either, for the same reason. What does help is a different family, namely periodic in-field testing of cores against known-answer tests, redundant execution of critical computations with comparison, application-level checksums that verify results rather than storage, and, crucially, fleet-level detection infrastructure, because a defect that appears in one core in ten thousand is invisible at machine level and obvious at fleet level.
And there is a hardware-design consequence that generalises. Detection is more valuable than correction, because an error you detect can be handled by any policy you like, and an error you miss has already escaped. A parity bit that only detects is a large improvement over nothing. The jump from detection to correction is a smaller improvement than the jump from nothing to detection.
8.4 Containment, and the poison bit
Now the central RAS mechanism, and the one worth being able to derive rather than recite.
An L3 cache line fails its ECC check. The data is known bad and cannot be corrected. What should the hardware do?
Option one, raise a fatal error immediately. It is simple and it is wrong most of the time. That line might be a page of a file cache nobody will read again, or a stale copy of something being overwritten, or memory belonging to a process about to exit. Killing the machine on the chance that somebody might have wanted it is throwing away a healthy system to protect data that nobody wanted.
Option two, mark it and let it travel. Attach a poison marker to the bad data and let it propagate through the fabric like any other data. The line moves, gets copied, gets written back, and stays poisoned. Only when a consumer actually uses the value is an error raised, and it is raised at the consumer, which knows exactly what it was doing.
That is the design, and its value is precise. Poisoning converts an error with unknown blast radius into an error with a known consumer, which converts a machine-level failure into a process-level failure. When the poison is consumed by a load in a user process, the core takes a synchronous, precise exception attributed to that instruction, and the operating system kills one process. The other four hundred processes on the machine never notice. That is the difference between an unplanned reboot and a log entry.
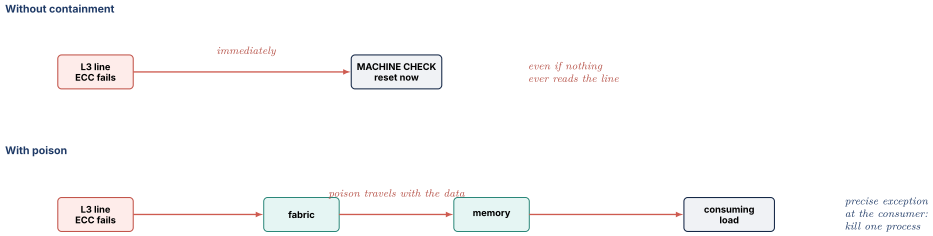
Now the part that makes this a microarchitecture question rather than a policy question. Poison costs, in four specific places, and being able to list them is what separates having read about it from having designed it.
Storage. Poison is state, so it needs a bit per protected granule, in every cache, every buffer, and every queue that can hold data. It is not one bit on a chip. It is a bit everywhere data can rest.
The fabric. Poison has to survive transport, so the interconnect protocol needs a way to carry it. Recent AMBA revisions include explicit poison signalling on data channels, typically at a granularity of one indication per some number of data bytes rather than one per beat. If you cite a revision or a granularity, check it rather than assert it, because it has changed across versions.
Partial writes. This is the subtle one. If a 64-byte granule is poisoned and someone writes 8 bytes into it, the poison must not be silently cleared, because the other 56 bytes are still bad. So the read-modify-write path, the same path ECC already forces from Part 11 of DRAM Controllers JEDEC and DFI, has to propagate poison through the merge. A design that clears poison on any write has converted a contained error back into silent corruption, which is the worst possible outcome and an easy bug to write.
Speculation. And this is the best interaction to have ready, because it ties the whole notes set together. If a speculatively executed load consumes poison and raises the error immediately, then a mispredicted branch can kill a process that was never going to execute that load. Worse, it is attacker-controllable: from Security Side Channels and Speculation, an attacker who can steer speculation can steer it into poisoned memory and cause a denial of service. So the error must be raised only when the consuming instruction is non-speculative, which means poison consumption has to be tracked through the out-of-order machinery of Out of Order Execution and resolved at retirement, exactly like any other precise exception. That is a real microarchitectural obligation created by a reliability feature, and it is precisely the kind of cross-domain answer that lands well.
8.5 Error injection, because you cannot verify what you cannot trigger
Here is the uncomfortable fact about RAS logic. It is the least-exercised logic on the chip and among the most consequential. In normal operation it does nothing for years. Then, once, it has to do exactly the right thing, and if it does not, the failure mode is a corrupted database or a car that does not stop.
Ordinary verification does not reach it, because nothing in a functional test naturally produces a double-bit error in an ECC-protected array at a moment when a poisoned line is being written back. So the errors have to be manufactured, and the manufacturing has to be designed in from the start.
The mechanisms, from silicon outward:
Writable check bits. A control that lets the ECC bits be written directly, so software can construct a word whose data and check bits disagree. Write it, read it back, and the correction path runs for real. This is the cheapest and most useful mechanism and it is the one to name first.
Inject-on-next-access controls. A register that corrupts the next write to a given array, or forces the next read to report a syndrome. Useful where the check bits are not directly addressable.
A fault-injection register per error node. Arm's RAS architecture defines the concept of an error node with its own record and control registers, and injection is provided at that granularity so the whole reporting path, meaning record, status, address, syndrome, and interrupt or exception, is exercised, not just the correction.
Software-level injection. ACPI defines an error-injection interface so that operating-system-level error handling can be tested on a production platform without a lab. It is testing a different layer, the OS's response, and it does not substitute for the hardware-level mechanisms.
Simulation and gate-level fault campaigns. Before silicon, the same errors are injected in RTL simulation, and for the safety metrics of Part 9, systematically across a fault list at gate level to measure what fraction of faults the safety mechanisms actually detect. That campaign is not a nice-to-have in a safety context. It is the evidence that produces the number.
Here is the sentence to have ready. If the RAS logic cannot be triggered on demand, it has not been verified, and an unverified error path is worse than no error path because it creates false confidence.
8.6 Machine check, error records, and what firmware does with them
DFT and Silicon Debug 8.7 introduced the severity classes and the first-error-sticky discipline, so this builds rather than repeats.
The machine-check concept is that the system contains a set of error nodes, meaning things like a cache, a memory controller, an interconnect port, or a core's execution logic, each of which owns a small bank of registers describing the most significant error it has seen. Architecturally you find this as the machine-check banks on x86 and as the RAS error records on Arm, and the structure is remarkably similar. There is a status register with valid bits, a type and severity encoding, an overflow bit and a sticky first-error indication. There is an address register. There is a syndrome or implementation-defined detail register. And there is control for whether the node reports by interrupt, by exception, or only by being polled.
Getting the fields right at design time is what makes field failures diagnosable, and the list is short enough to memorise: what kind of error, how severe, is the address valid and what is it, is the syndrome valid and what is it, was this the first error, did more errors arrive after it. Missing "was this the first" is the classic mistake from DFT and Silicon Debug 8.7, because a cascade of errors is mostly consequences of the first and a log that keeps only the latest describes the wreckage rather than the cause.
Delivery splits into two philosophies and the split matters.
Firmware-first means the error is delivered to firmware at the highest privilege level, which reads the implementation-specific registers, interprets them with knowledge of this particular chip and this particular board, and hands the operating system a standardised record delivered by a generic hardware error source. That record follows the Common Platform Error Record format, which is defined in the UEFI specification and consumed through ACPI's platform error interfaces. The advantage is enormous and structural. The operating system never has to know the implementation-defined encoding of a particular chip's error registers, so one OS binary works across every platform, and a chip erratum can be papered over in firmware. The disadvantage is latency and trust. Every error takes a trip through firmware, and firmware bugs in this path are catastrophic and hard to update.
OS-first means the operating system reads the hardware registers directly. Faster, and it requires the OS to carry per-implementation knowledge, which is exactly the x86 machine-check model and exactly why operating systems carry large tables of processor-specific decoding.
What software does with the records is the serviceability payoff from 8.1, and it is worth naming concretely because it is what makes the logging worth building. Corrected errors are counted per physical page. When a page crosses a threshold the operating system takes it out of service by copying its contents elsewhere and never allocating it again, converting a future uncorrectable error into an invisible maintenance action. Counts per memory module identify a failing part by its physical slot so a technician replaces the right one. Counts per core allow a core to be taken offline. And the records feed a fleet-level database where a pattern across many machines identifies a systemic problem that no single machine's log could ever reveal, such as a bad batch, a firmware bug, or a thermal issue in one rack.
8.7 RAS as a design driver, which is the IBM framing
The reason to know this material rather than merely to have heard of it is that in some design cultures RAS is not a feature added at the end. It is a constraint that shapes the microarchitecture from the beginning. IBM's mainframe and server processors are the standard public example, and their published documentation and papers describe a set of mechanisms that only make sense if reliability is a first-class requirement.
The pattern is worth understanding as a set of consequences rather than as a product list.
If you want to retry an instruction after a transient fault, you need a checkpoint. Recovering from a soft error by re-executing means having a known-good architectural state to return to and a way to detect the fault before that state is committed. That is a pipeline-level design decision made at the beginning of a project, not bolted on. Where the checkpoint boundary sits, what has to be held, and how retry interacts with in-flight memory operations are all part of it.
If you want to migrate a workload off a failing core, you need to be able to transplant architectural state. That means state must be enumerable and extractable, and the mechanism to write it into a different core must exist. Again, an early structural decision.
If you want memory to survive an entire DRAM device failing, symbol-level codes and spare devices are required, which changes the memory controller's granule, its check-bit layout and its read-modify-write behaviour. That is the material in Part 11 of DRAM Controllers JEDEC and DFI and section 7.11 of SRAM Arrays and ECC, where the symbol codes are built.
If you want to survive a bad wire on a memory or interconnect link, the link protocol has to support remapping lanes, which means spare lanes, a training sequence that can be re-run in the field, and a protocol that tolerates a reduced-width mode.
None of those is a feature you can add in the last six months. Each one changes the pipeline, the memory controller, or the link protocol. That is what "RAS is a design driver" means, and it is the framing to use when the topic comes up: not "we added ECC", but "these requirements changed the microarchitecture, here is which one changed what."
The counterweight to have ready, because a good interviewer will ask for it: all of it costs area, power and complexity, and the correct level depends entirely on the product. A mainframe pays for instruction retry and spare cores because an hour of downtime is measured in serious money. A phone does not, because the failure mode is an app restart and the customer's tolerance is different. Being able to say where the line falls, and why, is a better answer than advocating for maximum RAS everywhere.
09.Part 9, functional safety
9.1 What the standard is actually about
ISO 26262 is the automotive functional-safety standard. Three clarifications first, because each is a common misunderstanding.
It is about malfunctioning behaviour of electrical and electronic systems causing unreasonable risk. That is the system doing something wrong and somebody getting hurt. It is not about security, which is a different standard family. It is not about quality or reliability in the ordinary sense. A system can be spectacularly unreliable and still be safe, if every failure results in a safe state, and it can be highly reliable and unsafe, if the rare failure is catastrophic and undetected.
It is about risk, not about perfection. The standard never asks for a system that cannot fail. It asks you to identify the hazards, quantify how bad each is, and apply an amount of rigour proportional to that.
And it is process plus evidence. Roughly half of what it demands is not a mechanism at all but a documented argument that you did the right things, traceable from hazard to requirement to design element to verification result. Engineers new to it are consistently surprised by how much of it is paperwork, and consistently wrong about that being pointless. The paperwork is the mechanism for systematic faults, as 9.3 explains.
9.2 ASIL, assigned rather than chosen
The level of rigour required is the Automotive Safety Integrity Level, from A to D with D the most demanding, plus QM meaning no safety requirement beyond ordinary quality management.
It is not chosen by the designer. It is derived, for each identified hazard, from three factors assessed in a hazard analysis and risk assessment.
Severity, how bad the harm is, from no injuries to life-threatening or fatal.
Exposure, how often the vehicle is in the situation where that hazard matters.
Controllability, how likely an average driver is to avoid the harm once it starts.
Work an example. Unintended full braking at highway speed. Severity is at the top: at 70 mph this is potentially fatal. Exposure is high: highway driving is a large fraction of vehicle time. Controllability is poor: the driver behind you has no chance. The combination lands at ASIL D. Now a rear-view camera image freezing. Severity is real but lower, exposure is limited to reversing manoeuvres, controllability is decent because the driver can look over their shoulder. That combination lands much lower, often ASIL B or A depending on the assessment.
Two things follow that surprise people. The same component can carry different ASILs for different hazards, because the ASIL attaches to the hazard, not to the part. And ASIL can be decomposed. A requirement at ASIL D can sometimes be met by two sufficiently independent elements at lower levels, which is the formal justification for architectures like the safety island of 9.7. But the independence must be argued and demonstrated, which is what dependent-failure analysis is for, and claiming decomposition without demonstrating independence is the standard way people get it wrong.
9.3 Systematic and random, and why they get completely different treatment
This is the single most useful distinction in the standard, and stating it cleanly is worth more than any number.
A systematic fault is in the design. A misread requirement, a state machine that is wrong in a corner case, a synthesis constraint that was never applied, a tool that miscompiled. It is present in every unit ever built and it will manifest whenever the triggering condition occurs. It has no failure rate, because it is not probabilistic. It is deterministic, waiting for its input.
A random hardware fault is physical and occurs unpredictably during operation. A particle strike flipping a bit, a transistor that has degraded past its margin, a solder joint cracking, an open circuit from electromigration. These are the mechanisms of Reliability Aging and Variation and they genuinely do have a rate.
The treatments are therefore different in kind, not in degree.
Systematic faults are attacked by process, because you cannot measure your way out of a design error. Requirements traceability so that every design element exists because a requirement demanded it. Reviews and independence in verification. Coding standards and static analysis. Configuration management. And tool qualification, which is the one that surprises hardware engineers: if a synthesis tool or a formal checker could introduce or fail to detect a fault, the standard wants evidence that the tool is fit for that use. That is why safety-critical projects use qualified tool versions and cannot casually upgrade.
Random faults are attacked by detection and quantification, because you cannot eliminate a particle strike. You add mechanisms such as ECC, parity, lockstep comparison and self-test, and then you measure the fraction of faults they catch, which is the diagnostic coverage, and you compute the metrics in 9.4.
Here is the one-sentence version. You cannot test your way out of a design error and you cannot design your way out of a particle strike, so the standard uses rigour for the first and arithmetic for the second.
9.4 The metrics, worked
Three numbers characterise the hardware side, and they are quoted constantly.
SPFM, the single-point fault metric, is the fraction of the hardware's failure rate that is not capable of causing a safety-goal violation on its own. A fault is a single-point fault if there is no safety mechanism covering it and it alone can violate the goal. A residual fault is the uncovered remainder of a fault that a mechanism partially covers. High SPFM means almost nothing can kill you by itself.
LFM, the latent fault metric, deals with a subtler failure. A fault that does nothing on its own and is not detected sits there having quietly disabled a safety mechanism, waiting for a second fault that the now-broken mechanism was supposed to catch. The classic example is exactly the comparator in a lockstep pair. If the comparator's output is stuck at "match", the lockstep pair keeps running, everything looks fine, and the redundancy that the whole safety argument rests on has silently ceased to exist. LFM asks what fraction of such faults you detect, which means you have to test the tester, periodically, and that requirement is the reason runtime self-test of safety mechanisms exists.
PMHF, the probabilistic metric for random hardware failures, is the bottom line: the average probability per hour of operation of violating a safety goal, expressed in FIT.
The commonly published targets, which appear in ISO 26262 part 5, are these. Treat them as the values usually cited rather than as something to recite as certain, and confirm against the current edition of the standard if a number is going into a document.
| SPFM | LFM | PMHF | |
|---|---|---|---|
| ASIL B | percent | percent | FIT |
| ASIL C | percent | percent | FIT |
| ASIL D | percent | percent | FIT |
Work SPFM concretely, because the arithmetic is easy and the denominator is where people slip. Take a block whose total random failure rate is 1,000 FIT, apportioned across its elements by area or gate count. Classify each element's faults into three bins: safe faults that cannot violate the goal at all, faults covered by a safety mechanism, and residual faults that are neither. Suppose 400 FIT are classified safe, 594 FIT are covered by ECC and lockstep, and 6 FIT are residual.
The metric is one minus the uncovered share of the whole failure rate, safe faults included in the denominator:
which clears the 99 percent ASIL D target. Resist the temptation to report percent instead. That ratio is the diagnostic coverage of the faults that are not safe, which is a different quantity that happens to land nearby, and quoting one when you mean the other is a cheap way to look unfamiliar in a review.
Notice what that denominator does to the incentives. Safe faults sit in the denominator and never in the numerator, so how a fault gets classified is itself worth metric points.
Now the honest part, and the part that shows real familiarity. The argument is almost never about the arithmetic, it is about the classification. Deciding that 400 FIT of faults are "safe", meaning that a fault there cannot propagate to a hazardous output, is a claim, and it is much cheaper than adding a safety mechanism. It is also where analyses get contested in review, and where a fault-injection campaign earns its keep, because injecting faults into elements you claimed were safe and observing whether they reach an output is the evidence that the claim is true. When somebody asks how you would raise a marginal SPFM, "re-examine the safe-fault classification with an injection campaign" is a more sophisticated answer than "add more ECC."
9.5 The lifecycle, and what a hardware designer actually hands over
The safety lifecycle runs from concept to decommissioning, and the hardware designer's part sits in the middle. Compressed to the part that matters:
An item definition says what the system is and what it does. A hazard analysis and risk assessment produces the hazards and their ASILs, and from those, safety goals, which are top-level statements like "the system shall not apply unintended braking above 5 percent". A functional safety concept allocates those goals to architectural elements, and a technical safety concept turns them into technical requirements. Those flow down into hardware safety requirements, which is where the design work starts. Design proceeds, analyses are performed, verification produces evidence, and everything is assembled into a safety case, which is the argument, with evidence, that the item is acceptably safe.
What a hardware designer produces, concretely, is a list worth being able to give:
Hardware safety requirements traced to design elements, so that every safety mechanism exists because a requirement demanded it and every requirement is discharged by something.
An FMEDA, meaning failure modes, effects and diagnostic analysis, which is the spreadsheet-shaped artifact behind 9.4: every element, its failure rate, its failure modes, which are safe, which are covered, by which mechanism, with what diagnostic coverage.
Safety analyses: FMEA and fault-tree analysis for how failures propagate, and dependent failure analysis for whether elements you claimed were independent really are, whether through shared power, shared clock, shared reset, physical adjacency, or shared tooling.
Fault-injection results substantiating the claimed diagnostic coverage and the safe-fault classification.
A safety manual, sometimes called assumptions of use: what the integrator must do for the safety argument to hold. "The self-test must be run at least once per driving cycle." "The two supplies must be independent." "The comparator's error output must be connected to something that reaches a safe state within 10 milliseconds." A safety element out of context, a processor IP delivered to many customers, lives or dies by this document, because it is the only way the IP vendor's argument connects to the integrator's system.
Evidence of tool qualification for anything in the chain that could introduce or hide a fault.
Here is the framing to use if asked what surprised you about safety work. Most of it is not mechanisms, it is the traceable argument, and the mechanisms exist to make the argument possible.
9.6 Lockstep, and why the delay is the interesting part
The workhorse mechanism for a processor is dual-core lockstep: two identical cores, the same inputs delivered to both, and a comparator checking their outputs every cycle. Any single random fault in one core produces a mismatch, the comparator raises an error, and the system goes to a safe state.
Its properties are stark. It gives very high diagnostic coverage of the core's logic, which is otherwise extremely hard to achieve. You cannot put ECC on a pipeline. It costs more than twice the area and power of the core, since you pay for the second core plus the comparator plus the delay structures below, and it delivers no performance at all, because the checker core does no useful work. And it detects without correcting. A mismatch tells you something is wrong, not which core is right, so the response is a safe state, not a repair. Three cores voting would correct, which is why triple modular redundancy exists in space and in some rad-hard designs, but the area for a third core is rarely justifiable in automotive.
Now the delay, which is the detail that separates a real answer from a textbook one.
If the two cores run in exactly the same cycle with exactly the same state, they are exposed to exactly the same environment at exactly the same moment. Any disturbance that affects both cores identically at the same instant can produce the same wrong result in both, whether that is a supply droop, an electromagnetic interference event, a clock disturbance, or a nearby switching transient. The comparator sees two identical values, declares a match, and the fault passes straight through the mechanism the whole safety argument depends on. That is a common-cause failure, and it defeats redundancy completely.
The defence is temporal diversity. Run the checker core a fixed number of cycles behind the main core, typically one or two, sometimes more. Then a disturbance at a given instant arrives when the two cores are in different pipeline states, computing different instructions, so its effect on each differs, so the comparison catches it. Delaying the inputs to the checker and delaying the main core's outputs by the same amount before comparison is what makes the comparator see aligned data. The delay lines on both sides are the structural cost of the idea.
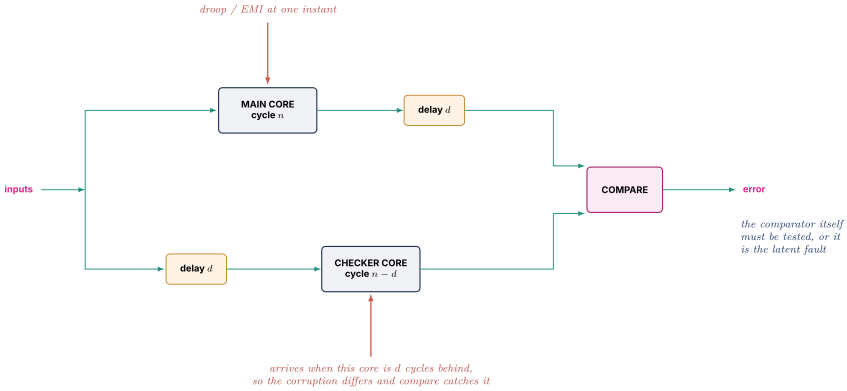
Two further defences are commonly combined with the delay and are worth naming. Physical separation of the two cores on the die, so a localised event such as a particle, a hot spot, or a supply anomaly in one region cannot hit both. And layout diversity, implementing the checker with a different placement or orientation so that a systematic layout-dependent weakness does not appear identically in both. Each of those addresses a different common-cause channel, and dependent-failure analysis in 9.5 is precisely the exercise of enumerating those channels: shared clock, shared supply, shared reset, physical proximity, shared design and tooling.
And here is the point from 9.4 that closes the loop. The comparator is the thing that must not fail silently. A comparator stuck at "equal" disables the entire mechanism invisibly. So it is periodically checked, typically by injecting a deliberate mismatch and confirming that the error output asserts, which is the latent-fault metric made concrete.
9.7 The rest of the toolkit
ECC and parity on everything that stores. Caches, register files, tightly-coupled memories, buffers. From SRAM Arrays and ECC, and the safety-specific angle is that end-to-end protection matters more than protecting each stage: data that is checked in the memory, unprotected while it crosses a bus, and re-checked at the destination is unprotected exactly where the transport error would occur. So the check bits should travel with the data across the whole path.
Runtime built-in self-test. The manufacturing BIST of DFT and Silicon Debug Part 5, re-run in the field. Logic BIST and memory BIST are executed at key-on, at key-off, or in slices during operation, to catch faults that developed since the last test. That is how you attack latent faults in logic that has no other detection. The constraint is that BIST is destructive to state, so running it during operation requires either a window where the block is idle, or duplicated resources so one copy can be tested while the other serves, and the scheduling of those windows is a real system design problem rather than a detail.
Watchdogs, per 4.4, and specifically the window and two-stage variants, because a simple watchdog is defeated by exactly the stuck-loop case it exists to catch.
Memory protection and freedom from interference. A high-ASIL task must not be corrupted or starved by a QM task sharing the same silicon. That means memory protection units enforcing address separation, and it means bandwidth and latency isolation at the interconnect. Those are the quality-of-service mechanisms of Interconnect and AMBA and Part 8 of DRAM Controllers JEDEC and DFI, recruited for a safety argument rather than a performance one. The phrase for it is freedom from interference, and it must be demonstrated, not asserted.
The safety island. The dominant pattern in modern automotive SoCs, and worth understanding because it explains the whole architecture of those chips. You cannot make a large GPU or neural accelerator ASIL D. The area cost of lockstepping it is absurd and the diagnostic coverage argument is intractable. So instead you build a small, high-ASIL, lockstepped subsystem whose job is to monitor the large low-ASIL complex, checking its outputs for plausibility, watching its timing, and holding the ability to force a safe state. The large complex does the work. The small island guarantees that if the work goes wrong, something safe happens. That is ASIL decomposition made physical, and its correctness rests entirely on the independence argument between the island and the complex. Shared power, shared clock and shared reset are exactly what dependent-failure analysis exists to interrogate.
9.8 What it costs, honestly
Worth being able to state, because an interviewer will want to know whether you understand the trade rather than just the mechanisms.
Area and power: more than double for anything lockstepped, plus ECC overhead, plus BIST logic, plus the island.
Performance: the checker core produces nothing, self-test windows steal time, and interference-freedom mechanisms cap what any one client can use.
Schedule: the analyses, the fault campaigns and the documentation are real engineering months, and they are on the critical path to a safety case rather than to tapeout, so they are easy to under-plan.
Flexibility: qualified tools cannot be casually upgraded, and a change late in the project invalidates analyses that must be redone.
Which is exactly why the ASIL is derived from the hazard rather than chosen, and why decomposition and safety islands exist: the entire architecture of a safety-critical SoC is an attempt to apply the expensive rigour only where the hazard analysis says it is required.
10.Part 10, the interview questions, with answers
Twenty questions of the kind actually asked across the four areas, each with a model answer written the way a strong candidate would speak it rather than the way a textbook would write it, the follow-up the interviewer will reach for, and the trap where there is one. Read them out loud. They are calibrated for one to three minutes of speech, which is the real constraint.
Q1. Why does an interrupt controller exist? Design one for three devices and one core.
Model answer. Start with why not to have one. You could poll, and the reason polling fails is that the polling rate is set by the tightest deadline while the event rate is set by the devices. If I have a UART, a timer and a DMA engine, and the DMA needs a response inside 5 microseconds, I have to poll every 5 microseconds. Each status read is an uncached access across the fabric, call it 100 nanoseconds, so a three-device pass is 300 nanoseconds and I have spent 6 percent of the core permanently to serve about 17,000 events per second. Eleven passes in twelve find nothing. At thirty devices it is 60 percent, and at a hundred devices one pass no longer fits inside the deadline at all. Polling doesn't get expensive, it becomes arithmetically impossible.
So the devices tell the core instead. The naive version is one wire per device into the core, and that works for three. What kills it is that the core then has to carry a pending bit, a mask bit, a vector and a slice of priority comparison per wire, so its boundary and its state grow with the peripheral mix, and with four cores you either replicate every wire four times or you build something in the middle. Factoring that common logic out of the core is the interrupt controller. It wasn't designed so much as left behind.
For three devices and one core I'd build a pending bit per source, edge or level configurable per source because the choice belongs to the device. I'd build an enable bit per source with separate set and clear registers so two agents can touch different sources without a lock, a priority value per source, a priority encoder producing the current winner, a single request line to the core, a read-to-acknowledge register that returns the winning ID and moves it to active, and a write-to-complete register. That is genuinely the whole thing, and everything in a GIC or a PLIC is that plus scale, routing and virtualisation.
The follow-up. "Where's the timing problem when you scale it to 1,000 sources?"
The priority selection. A flat 1,000-way comparison in one cycle will not close, so it's the same structure as any large arbiter: a per-group winner, then a winner among groups, pipelined so selection and dispatch are in different cycles, with the consequence that the selected source may have been disabled in between, so I need a suppression path. That's the same shape as the memory-controller arbiter problem and the same fix.
The trap. Jumping straight to "the GIC has a distributor and redistributors." That answers a different question. The interviewer wants to see whether the block is inevitable to you or memorised.
Q2. Level-triggered or edge-triggered? What breaks with each?
Model answer. They fail in opposite directions and both failures are common.
Level means the device holds the line asserted until software clears the condition at the device. Its failure is the interrupt storm: if the handler returns without clearing the source, the line is still high, the controller signals again immediately, and the machine livelocks entering and leaving a handler. So the rule with level is that the handler must clear the condition at the device before it signals end-of-interrupt, and if it can't, it must mask the source.
Edge means the device pulses and the controller latches a pending bit. Its failure is the lost interrupt, and it's worse because it's silent. If the handler clears the pending bit at the end rather than at the start, and a second event arrives in between, that clear erases an edge that was never serviced. The line is low, the pending bit is clear, the data is sitting in the device, and nothing anywhere records that it happened. The port just stops working.
So the discipline runs in opposite directions. With edge, clear pending first and then service the device. With level, service the device first and then complete. They're exactly opposite orders, which is why mixing them up is such a productive source of bugs.
The follow-up. "Two devices share one level line. What's different?"
The line stays asserted after the first handler clears its own device, because the second is still asserting. So the handler chain has to keep walking the source list until a full pass finds nothing asserted. Stopping at the first match leaves the line high and you're back to the storm. That's the main reason shared level interrupts are considered a design smell and one of the reasons message-signalled interrupts were such an improvement, since each message is its own interrupt and nothing is shared.
The trap. Saying one is simply better. Level is right for conditions that persist, which is most peripherals, and edge is right for genuinely instantaneous events. Real controllers make it programmable per source because the controller has no idea what's wired to it.
Q3. Walk me through the life of an interrupt, and tell me what end-of-interrupt is for.
Model answer. Four states per source. Inactive, pending when the device asks, active once the core has acknowledged that specific source, and active-and-pending if the same source asks again while its handler is running. That fourth state exists so the second request isn't lost.
The sequence is: the core takes the exception, reads the acknowledge register, which returns the ID, moves the source to active and raises the core's running priority to that source's priority. Then the handler services the device, which is what de-asserts the line. Then the handler writes end-of-interrupt with the same ID, which drops the running priority and deactivates the source.
EOI exists because the controller has no way to know when a handler is finished. It can't deactivate on acknowledge, because for a level source the line is still asserted for most of the handler's duration and it would immediately re-select. That's the storm. And it can't never deactivate, or the source fires once and never again. So software has to say. Getting the order wrong gives you the storm. Forgetting EOI entirely gives you a single dead peripheral on an otherwise perfectly working machine, which is a horrible bug to chase because everything else works.
The follow-up. "Why does GICv3 split EOI into two operations?"
For virtualisation. Writing the EOI register drops the priority. Writing the deactivate register deactivates. A mode bit says whether the first also does the second. A hypervisor wants to hand a physical interrupt to a guest, but the guest must not deactivate a physical source, and the source has to stay active until the guest is really done, which might be after the guest has been descheduled. So the hypervisor drops priority immediately so the system isn't blocked at the guest's priority, injects a virtual interrupt, and deactivates later when the guest signals completion. The split isn't an Arm quirk, it's the only way to let a guest own an interrupt's lifetime without owning the hardware.
The trap. Describing EOI as "telling the controller you're done" and stopping. That's the what. The interviewer is checking whether you know what happens if you don't, and specifically whether you know the ordering constraint against clearing the device.
Q4. Eight cores, one device interrupt. Who takes it?
Model answer. Three options and they're a real architectural choice, not a configuration detail.
Pin it to one core, which is what you want when the handler touches per-core state, when the device is physically near one cluster, or when you need reproducibility. An interrupt that lands on a different core every run is a bug that reproduces on Tuesdays.
Let the controller pick a core that isn't already at a higher running priority. Arm calls it 1-of-N. It balances load with no software involvement and it's wrong whenever the handler has affinity to per-core state.
Or broadcast, which for a device interrupt is almost always wrong because cores enter a handler to service one device and of them wasted the entry and then fought over a lock.
Arm expresses the target as a four-level affinity value rather than a flat core number, matching MPIDR, because a big system is a hierarchy of socket, die, cluster and core, and that lets the distribution hardware prefer a local core and avoid crossing a die boundary. The hardware cost is that routing state is per source, so a thousand shared interrupts means a thousand routing entries, which wants to be a small RAM rather than flops.
The follow-up. "How do you change an interrupt's target safely while the system is running?"
Disable the source, change the routing, re-enable. Changing the route of an interrupt that is currently pending is exactly the case specifications call out as unpredictable, and hardware that doesn't make it safe has created a bug that appears once a month under load. If I owned the block I'd want that sequence in the integration document and, ideally, an assertion firing if software rewrites a route while the source is pending, because that turns a field mystery into a simulation failure.
The trap. Not distinguishing load balancing from affinity. The interviewer often wants you to volunteer that automatic distribution is the wrong choice for a handler with per-core state, and candidates who've only read about it treat "spread it around" as strictly better.
Q5. What is a message-signalled interrupt and why did the industry move to it?
Model answer. The device doesn't have an interrupt pin. When it wants attention it performs an ordinary memory write of a specific value to a specific address, and that address is decoded by the interrupt controller. The controller turns the write into a pending interrupt and everything downstream is the same.
Pins are the obvious motivation and the least interesting one. There are three better reasons.
Numbers: a PCIe function with MSI-X can have up to 2048 distinct messages, against one for a pin, so a network card can have an interrupt per receive queue per core, which is the only reason multi-queue networking scales.
No sharing, so the wired-OR chain-walking problem disappears. Each message is its own interrupt with its own handler.
And ordering, which is the one I'd lead with because it's a correctness property rather than a performance one. A wire is signalled out of band from the data, so the interrupt can arrive at the core before the DMA data it's announcing is visible, and the handler reads stale memory. Drivers historically defended by reading a device register in the handler purely to flush the path. A message travels on the same path as the data, so if the fabric keeps writes ordered, the interrupt cannot overtake what it's announcing. That's a class of driver bug eliminated by changing the signalling mechanism.
The follow-up. "If any master can write any address, what stops a device forging another device's interrupt?"
Nothing, unless you translate. That's what Arm's ITS is for. The write carries an EventID as data, and the fabric independently supplies a DeviceID derived from who the requester actually is, which the device can't forge. The ITS walks a per-device table in memory to map that pair to an interrupt ID and a target. So a device can only raise interrupts software entered into its own table. It's structurally the same move as an IOMMU, where an untrusted requester's identity is used to look up what it's permitted to do, and it's why the table lives in memory, because you can't have a register bit per interrupt when there are a hundred thousand of them.
The trap. Answering "it saves pins" and stopping. True, and the least important of the four reasons.
Q6. Compare Arm's GIC and RISC-V's PLIC.
Model answer. They're the same problem solved at opposite ends of the hardware-software split, which makes the comparison genuinely instructive rather than a trivia question.
The GIC builds policy into silicon. It maintains a running priority per CPU interface, so preemption is a hardware decision. It has a priority mask register, a binary point that controls how much of the priority field participates in preemption, four distinct interrupt classes with different state locality, affinity routing across a four-level hierarchy, and a whole translation service for message interrupts.
The PLIC is deliberately flat. Priority per source, enable bits per context, one threshold register per context, and a claim/complete register. No running-priority stack, so no hardware preemption. If software wants nesting it raises the threshold itself in the handler and lowers it on exit. Timers and inter-processor interrupts aren't in the PLIC at all, they're in the CLINT, which holds mtime, mtimecmp per hart, and msip per hart.
There's one PLIC detail I really like. Claiming is a read that atomically returns the highest-priority pending source and clears its pending bit. So if several harts are enabled for the same source, exactly one wins the claim and the others read zero and return. That's hardware-provided mutual exclusion doing work that would otherwise need a lock, in a register read.
Worth knowing that the priority conventions run opposite ways, with lower more urgent in the GIC and higher more urgent in the PLIC, which is the kind of thing to check rather than assume.
The follow-up. "Where does the PLIC break down, and what replaced it?"
Two places. Enable bits are per context per source, so the register file grows as the product and a machine with hundreds of harts and thousands of sources is untenable. And there's no message path at all, so no efficient virtualisation. The Advanced Interrupt Architecture replaces it with the APLIC for wired interrupts, organised into delegating domains so machine level can hand a source to supervisor level or to a guest, and the IMSIC, a per-hart message receiver with separate interrupt files for machine, supervisor and each guest. Because a guest's file is its own page of physical address space, the hypervisor can map it into the guest and devices deliver interrupts to a running guest with no trap. That's the same endpoint GICv4 reached from the other side, which tells you the pressure was real.
The trap. Treating it as "Arm is complex, RISC-V is clean." The PLIC's simplicity has a cost that RISC-V itself concluded was too high, and saying so is a much better answer than picking a side.
Q7. Why is it hard to give every core the same view of time?
Model answer. Because a counter is one physical piece of logic and there is no such thing as the same instant across a die.
The requirement sounds trivial. Two cores read a counter, and if A reads it, sends a message to B, and B reads it, B must not see a smaller value. Software depends on that constantly and silently, in every profiler, every distributed trace, and every latency histogram.
The physics is that the counter sits somewhere, and its value takes real time to reach the far corner of a 15-millimetre die, on the order of nanoseconds once repeaters are counted. Then it has to cross into each core's clock domain, which is a synchroniser costing two or three destination cycles of uncertainty. Take a 50 MHz counter, so a 20-nanosecond tick, a 3-nanosecond flight time and a few nanoseconds of synchroniser uncertainty: if two cores land on opposite sides of a tick boundary they report values one tick apart for the same real instant. Now A reads 1,000,000, hands work to B, B reads 1,000,000 or even 999,999, and software subtracting unsigned counters gets zero or an enormous positive number from the wrap. That's a real bug family and it originates exactly there.
Then it gets worse for four reasons. A core that was powered down has to have its view re-established on wake and must not be used until it is. Crossing a package boundary to another socket has no shared clock at all, so it needs a synchronisation protocol at boot plus periodic correction rather than continuous broadcast. Virtualisation needs a per-guest offset so a migrated guest still sees monotonic time. And distributing a 64-bit value across the die at tens of megahertz is switching power on a network that never idles, so implementations distribute increments instead. That means every receiver has a local counter that must be initialised right and must never miss an increment, and missing one is a permanent offset on that core that no software can detect.
The follow-up. "How would you validate it?"
Two ways. In silicon, a ping-pong test: core A timestamps, hands a token to core B which timestamps immediately, repeated across every pair and in both directions. Any negative interval is a hard failure and the minimum observed interval bounds the skew. In design, an assertion that no two cores' distributed counter values ever differ by more than the architected bound, plus a formal property that a receiver's local counter can never miss an increment. And I'd want a debug register exposing each core's raw local value so the skew is directly observable in the lab instead of inferred, because inferring it from software timings is hopeless.
The trap. Answering "you use a global counter" as if that were the answer. Everyone uses a global counter. The question is what happens between the counter and the core.
Q8. What does it take for a debugger to halt a core, in a machine with seven other cores?
Model answer. Two things, and the second is what the question is really about.
First, halt has to be precise enough to be useful. A deeply out-of-order core has dozens of instructions in flight, so halting means draining what must complete, discarding what's speculative, and arriving at a defined architectural boundary so the state you read corresponds to a point in the program. That's the machinery the core already has for precise exceptions, so halt is normally built on it rather than being new.
Second, and this is the real answer. A halted core must still be a good citizen of the system. If core 0 halts holding a cache line modified, and core 1 asks for that line, core 0 has to service the snoop or core 1 hangs and I have converted a debug session into a system-wide deadlock. Same for any outstanding transaction another agent is waiting on. So debug halt is not "stop the clock", it's "stop the instruction stream while the coherence and bus logic stay live."
And that requirement propagates outward into why debug is a separate subsystem at all. It has to work when the core is broken, so it needs its own access path that doesn't use the core's load/store unit or the main interconnect, its own clock because the functional clock may be stopped or may be the problem, its own always-on power domain because the core's domain may be gated, and its own reset so that resetting the core doesn't drop the connection. That is also how you attach before the first instruction executes and debug a boot failure.
The follow-up. "Now halt all eight simultaneously."
You can't, exactly, and the honest answer is to say so and then say what you do instead. A cross-trigger network carries the halt from one core to the others, and it takes some number of cycles to cross the chip and cross clock domains. So core 1 executes some more instructions after core 0 stopped. That's fine if the latency is specified, because the analysis can account for it. It's not fine if it's unknown or variable, because then you can't tell whether an ordering you see in the captured state is real. A cross-trigger network with an unspecified latency produces evidence you can't reason about, which is worse than no evidence.
The trap. Talking only about the core's pipeline. Anyone who's debugged a real multiprocessor leads with the snoop problem.
Q9. RISC-V's Debug Module has both abstract commands and a program buffer. Why both?
Model answer. They're two answers to "how does the debugger read arbitrary state", with opposite trades, and the pairing is the interesting part.
Abstract commands are fixed-function. The debugger writes a command register saying "read general-purpose register 12" and the Debug Module does it directly, leaving the result in a data register. Fast, simple, no side effects, and complete only for what the designers anticipated, which is essentially the GPRs, with more being optional.
The program buffer is the escape hatch. It's a few words of writable storage from which the halted hart can be made to execute instructions. The debugger writes a short sequence, the hart executes it and re-enters debug state, and the result comes back through a data register. Because the hart is running real instructions on its own datapath, anything the ISA can do the debugger can now do: read a CSR, do a load or a store to inspect memory, read a floating-point register, execute a fence.
The general principle is worth stating because it recurs everywhere. A fixed-function unit is fast and simple and complete only for what you anticipated. Borrowing the machine's own general-purpose datapath is slower per operation but covers everything including what you didn't anticipate, for almost no extra hardware. The DM gets a tiny implementation and unlimited capability by making the core do the work. It's the same trade as microcode versus hardwired control, which is ground I've worked on directly.
The follow-up. "What if the hart is too broken to execute anything?"
Then the program buffer is useless, which is why the spec also allows a system bus access block in the DM that reads and writes memory directly without involving the hart. That's the mechanism you want when the core is wedged, and it's a good illustration of the layered design: three access mechanisms with different capability and different dependence on the thing you're debugging still working.
The trap. Presenting the program buffer as a workaround for a weak implementation. It's the deliberate design, and the DM's small size is the reward.
Q10. Estimate the bandwidth of full instruction trace on a modern core, and tell me what you'd do.
Model answer. Do the arithmetic first because it decides everything.
Four-wide core at 3 GHz sustaining IPC 2, so 6 billion instructions per second. If I emit a 64-bit program counter per retired instruction, that's 6e9 times 8 bytes, which is 48 gigabytes per second. From one core.
Now price where that could go. Off-chip, a trace port is a handful of pins, with public designs using maybe 4 to 32, and even a wide fast one lands in the low single-digit gigabytes per second, so I'm one to two orders of magnitude short. On chip, a 1 megabyte trace SRAM, already the size of a cache slice and therefore competing with performance a customer can measure, holds about 21 microseconds of history against a bug that happened four milliseconds ago. To main memory, 48 GB/s against a channel with maybe 25.6 GB/s of peak. I can't pay it, and if I could, paying it changes the timing of the thing I'm trying to observe, which destroys the only property that made trace worth having. And that was one core. Eight is 384 GB/s.
So the conclusion is not that compression helps. It's that compression is the reason trace can exist at all, and any answer that doesn't start with this arithmetic has missed the problem.
The follow-up. "So what do you actually build?"
Branch trace. The host already has the binary, so I only send what it can't derive. Then the bandwidth falls by two or three orders of magnitude and it fits. And I'd build filtering, so that you trace only one core, or only one address range, or only above a privilege level, plus a trigger to decide when to record, because as with any trace buffer the trigger matters far more than the depth.
The trap. Reaching for a bigger buffer. Doubling 21 microseconds to 42 against a four-millisecond problem is nothing, and saying so unprompted is the signal.
Q11. Explain branch-trace compression. What still has to be transmitted?
Model answer. One observation does all the work: the host analysing the trace already has the program binary, so the hardware doesn't need to send anything the host can compute for itself. Walk the instruction stream and ask what's derivable.
An arithmetic instruction or a load at address A of length L is followed by A plus L, and the host knows L from the binary. Nothing sent. An unconditional direct branch has its target encoded in the instruction. Nothing sent. A conditional direct branch has its target in the instruction, so the only unknown is taken or not taken. One bit. An indirect branch has a runtime target the host cannot know. Send the target, usually as a delta. An exception or interrupt is asynchronous, so the host has no idea where it happened or where it went. Send both.
Redo the arithmetic with a conditional branch every five instructions. That is 1.2 billion branches per second at one bit, which is 1.2 gigabits, 150 megabytes per second, against 48 gigabytes. A factor of 320, obtained purely by noticing that the receiver already has the program. In bits per instruction that's 0.2 as a floor. Real encoders land worse once you count everything else, and public material on real instruction trace tends to describe something in the region of a bit per instruction, so I'd quote 0.2 as what the mechanism implies and around 1 as engineering reality.
Here is what still has to go out. Indirect branch targets. Exceptions and interrupts. Periodic synchronisation packets carrying a full absolute PC, so a decoder can start mid-stream and recover after an error, which is a direct trade of bandwidth against how long a prefix is unusable. Context changes, meaning address space ID, VM ID, privilege level and security state, because an address is meaningless without knowing which address space it's in and the alternative is decoding kernel addresses against a user binary and producing confident nonsense. Timestamps. And overflow markers.
The follow-up. "What do you do when the sink can't keep up?"
Two options and only two. Stall the processor, which is intrusive and destroys the timing you were trying to observe. Or drop trace and emit an overflow marker so the decoder knows to resynchronise at the next sync packet. Real trace overwhelmingly drops, and the sentence I'd want to say is that trace is lossy by construction, because the alternative is to perturb the thing being measured. A stall mode usually exists for when completeness matters more than fidelity, and choosing it means accepting the bug may not reproduce.
I'd also mention two extra compressions, because they show you've thought past the basic idea. The first is aggregating branch outcomes into a bit vector emitted when it fills, since a two-byte packet carrying one bit isn't one bit. The second is a return-address stack inside the encoder, so a return that goes where the stack predicted costs one bit instead of an address. Which is a funny collision. That's the other RAS.
The trap. Forgetting that synchronisation packets exist. A candidate who describes pure branch compression and no sync has described something a decoder can never start decoding.
Q12. Eight cores each producing trace, merged through a funnel. How do you reconstruct the global order?
Model answer. First, by knowing that the merged order is not the event order, and being able to say why. Each encoder has its own FIFO at its own occupancy, so a packet from a busy core is delayed relative to one from an idle core. The funnel arbitrates, and arbitration doesn't preserve order across inputs. Encoders compress adaptively, so a burst is emitted later than quiet-period packets that logically follow it. And the cores may be at different frequencies, so cycles don't even mean the same duration.
The only fix is a common time base injected into every stream. A timestamp generator broadcasts, each encoder inserts the value into its own stream periodically, and the host uses those as anchors to interleave. Which means it inherits every problem from the system counter, the distribution delay, the domain crossing, and the cores that were powered down.
And then the honest limitation, which is the part I'd make sure to say. Timestamps are expensive, so they go in at intervals, not on every packet. Between two timestamps, ordering within a stream is exact and ordering across streams is unknown. So my cross-core resolution is the timestamp interval, not the cycle, and turning the interval down costs bandwidth on the resource that was already the constraint.
If I need finer causality than that, timestamps won't give it to me and I have to design it in: a cross-trigger with a documented latency to mark a common instant in every stream, or a global sequence number carried in the transactions themselves so the data establishes the order rather than the timing. I'd reach for the sequence number, because it converts a timing problem into a data problem and data survives buffering.
The follow-up. "How do you know which packet came from which core after the merge?"
Every stream carries a trace ID, which is the only reason a merged stream can be taken apart again. It's worth saying that this is the entire justification for having IDs. Without them a funnel is a shredder.
The trap. Assuming the funnel preserves order. It's the natural assumption and it is wrong, and the whole question exists to find out whether you assumed it.
Q13. Define correctable, uncorrectable, detected and silent. Which one worries you most?
Model answer. It's a two-by-two on whether you detected it and whether you corrected it.
Detected and corrected is a correctable error: ECC fixed it, you log it, count it, continue. Costs nothing and predicts the future, because a rising corrected-error count on one page or one part is a failure announcing itself.
Detected and not corrected splits further. If nobody has consumed the bad value yet, it's a deferred error and you have a choice about when to act. If it's been consumed, then it depends on whether you know the blast radius. If the affected context is known, meaning this instruction and this process, it's recoverable and killing that context is enough. If you don't know how far it spread, machine state is untrustworthy and you have to stop.
Undetected and corrected is empty by construction: you can't correct what you didn't detect.
Undetected and uncorrected is silent data corruption, and yes, that's the one. The machine computed the wrong answer and told nobody. It got written to a database, checksummed, replicated to three sites and served to users. Every other box has a defined response. This one has no response because nothing knows.
And it's not hypothetical any more. Google's Cores that don't count and Meta's silent-data-corruption work both report the same thing from fleets of hundreds of thousands of machines. Individual cores, the ones the papers call mercurial, compute wrong results occasionally while the rest of the chip is fine. Per-core rather than per-chip, data-dependent and intermittent, appearing after burn-in and deployment so manufacturing test couldn't have caught them, and sensitive to voltage, frequency and temperature so they may vanish at the operating point you debug at.
The follow-up. "So what do you do about SDC?"
Recognise first what doesn't help. Adding ECC to more arrays doesn't, because the corruption is in the compute rather than in storage. What does help is a different family, namely periodic in-field testing of cores against known-answer tests, redundant execution with comparison for the computations you care most about, application-level checks that verify results rather than storage, and fleet-level detection, because one bad core in ten thousand is invisible per machine and obvious per fleet.
There's a general principle underneath it that I'd want to state. Detection is worth more than correction, because a detected error can be handled by whatever policy you like, and an undetected one has already escaped. The step from nothing to parity is bigger than the step from parity to ECC.
The trap. Treating "uncorrectable" and "fatal" as synonyms. Most uncorrectable errors should not be fatal, and the mechanism that makes that true is the next question.
Q14. What is poison, and what does it cost you in the microarchitecture?
Model answer. Start with the decision it exists to avoid. An L3 line fails ECC and can't be corrected. If I raise a fatal error immediately, I might have just killed a healthy machine to protect a page of file cache nobody will ever read again. But if I ignore it, I've created silent corruption.
Poison is the third option. Mark the bad data, let it travel through the fabric like any other data, and raise the error only when something actually consumes it, at the consumer, which knows exactly what it was doing. When a user process's load consumes poison, the core takes a precise synchronous exception attributed to that instruction and the OS kills one process. The other four hundred never notice. So poison converts an error with unknown blast radius into an error with a known consumer, which converts a machine-level failure into a process-level one. That's the whole value.
Now what it costs, which is the part of the question I think is actually being asked.
Storage: poison is state, so it's a bit per protected granule in every cache, buffer and queue where data can rest. Not one bit on the chip. A bit everywhere.
The fabric: it has to survive transport, so the interconnect protocol needs to carry it. Recent AMBA revisions do have explicit poison signalling, typically one indication per some number of data bytes rather than per beat, and I'd check the revision before quoting a granularity because it's changed.
Partial writes: this is the subtle one. If a 64-byte granule is poisoned and someone writes 8 bytes into it, the poison must survive the merge, because the other 56 bytes are still bad. A design that clears poison on any write has silently converted a contained error back into silent corruption, and it's an easy bug to write because clearing feels like the natural thing to do on a write.
And speculation, which is my favourite part. If a speculatively executed load consumes poison and raises immediately, a mispredicted branch kills a process that was never going to execute that load. And it's attacker-controllable, because someone who can steer speculation can steer it into poisoned memory for a denial of service. So the error can only be raised when the consuming instruction is non-speculative, which means poison consumption is tracked through the out-of-order machinery and resolved at retirement, exactly like any other precise exception. A reliability feature creating a real obligation in the out-of-order core is the kind of coupling people don't expect.
The follow-up. "How do you test any of this?"
Error injection, designed in from the start, because RAS logic is the least-exercised and most consequential logic on the chip and nothing in a functional test naturally produces a double-bit error at the moment a poisoned line is written back. The cheapest and most useful mechanism is writable check bits, so software can construct a word whose data and ECC disagree and then read it back through the real correction path. Beyond that, inject-on-next-access controls, an injection control per error node so the whole reporting path is exercised and not just the correction, RTL-level injection before silicon, and a software-level injection interface for testing the OS's response. If the RAS logic can't be triggered on demand it hasn't been verified, and an unverified error path is worse than none because it creates false confidence.
The trap. Describing poison as "a bit that marks bad data" and stopping. That's the definition. The interviewer wants the four costs, and the partial-write and speculation ones are where the real design content is.
Q15. How do you decide what gets logged when an error occurs?
Model answer. Long before any error occurs, which is the design lesson. Once it happens, whatever you didn't build is gone.
The structure is a set of error nodes, things like a cache, a memory controller, an interconnect port, or a core's execution logic, each owning a small bank of registers about the most significant error it has seen. That's machine-check banks on x86 and RAS error records on Arm, and the shape is very similar.
Here are the fields I'd insist on. What kind of error and how severe. Is the address valid and what is it. Is the syndrome valid and what is it, because the syndrome is what identifies the failing bit and lets you correlate to a physical location in an array. A first-error sticky bit. And an overflow indication.
That first-error field is the one people get wrong and it's the most important. Cascading errors are mostly consequences of the first one, so a log that keeps only the most recent describes the wreckage instead of the cause. Keep the first error's full context, set overflow, count the rest.
Then delivery. Firmware-first means the error goes to firmware, which knows this particular chip and board, decodes the implementation-specific registers and hands the OS a standardised record through the ACPI platform error interfaces. The advantage is structural: the OS never has to know one chip's error encoding, so one OS binary works everywhere and an erratum can be papered over in firmware. The cost is a trip through firmware on every error and a very unpleasant class of firmware bug. OS-first is faster and requires the OS to carry per-implementation decoding tables, which is the x86 model and exactly why operating systems carry big processor-specific tables.
The follow-up. "What does software actually do with corrected-error counts?"
That's where serviceability pays. Count them per physical page and when a page crosses a threshold, copy its contents elsewhere and never allocate it again. A future uncorrectable error becomes an invisible maintenance action. Count per memory module so a technician replaces the right part instead of the whole board. Count per core so you can take a core offline. And feed them to a fleet database, where a pattern across many machines identifies a bad batch or a thermal problem in one rack that no single machine's log could ever show.
And it's worth doing the availability arithmetic out loud, because it justifies all of this. Availability is MTBF over MTBF plus MTTR. At 10,000 hours between failures and 4 hours to repair, that's 3.5 hours of downtime a year. Doubling the MTBF, which is an enormous multi-year effort, halves it. Cutting repair time to 4 minutes, by making failures detectable, attributable and locally recoverable, gets you to about 3.5 minutes a year. Sixty times better, far cheaper, and entirely a serviceability story.
The trap. Treating logging as a software problem. Every field in that record is a hardware decision made years earlier, and the ones you didn't build don't exist.
Q16. What's the difference between a systematic and a random fault, and why does it matter?
Model answer. It's the most useful distinction in functional safety and the two get completely different treatment.
A systematic fault is in the design. A misread requirement, a state machine wrong in a corner case, a constraint never applied, a tool that miscompiled. It's in every unit ever built and it manifests whenever its triggering condition occurs. It has no failure rate, because it isn't probabilistic, it's deterministic and waiting.
A random hardware fault is physical and occurs unpredictably in operation. A particle strike, a transistor degraded past its margin, a cracked joint, electromigration. Those genuinely have rates.
So you attack systematic faults with process, because you can't measure your way out of a design error. Requirements traceability so every design element exists because a requirement demanded it. Independent review and verification. Coding standards and static analysis. Configuration management. And tool qualification, which is the one that surprises hardware engineers. If a synthesis tool or a checker could introduce or miss a fault, you need evidence it's fit for that use, which is why safety projects pin tool versions and can't casually upgrade.
You attack random faults with detection and quantification, because you can't eliminate a particle strike. Add mechanisms, measure the fraction of faults they catch, and compute the metrics.
One sentence: you can't test your way out of a design error and you can't design your way out of a particle strike, so the standard uses rigour for one and arithmetic for the other.
The follow-up. "Where does that put verification effort on a safety project versus a normal one?"
Two places a normal project doesn't have. You need traceability from every safety requirement to the verification that discharges it, which changes how you organise a testplan rather than how much you test. And you need a fault-injection campaign, deliberately injecting faults across a fault list and measuring what fraction the safety mechanisms detect, because that number is the evidence behind the metrics, and it isn't something ordinary functional verification produces as a by-product.
The trap. Saying "systematic means it happens every time." Close, but the useful framing is that it has no rate, which is why it can't appear in the FIT arithmetic and has to be handled by process instead.
Q17. What is SPFM, and how would you raise a marginal one?
Model answer. The single-point fault metric is the fraction of the hardware's failure rate that can't cause a safety-goal violation on its own, either because the fault is safe or because a mechanism covers it. The published targets are around 90 percent for ASIL B, 97 for C and 99 for D, and I'd say "commonly cited" rather than assert them, because if a number is going into a document it needs checking against the current edition.
The arithmetic is easy as long as you are careful about the denominator, which is the total failure rate with safe faults included. Take a block at 1,000 FIT apportioned across its elements. Classify: safe faults, covered faults, residual faults. If 400 FIT are safe, 594 are covered and 6 are residual, then SPFM is one minus 6 over 1,000, which is 99.4 percent, and you meet the ASIL D target. The 594 over 600 figure is the diagnostic coverage of the non-safe faults, which is a different number, and I'd be careful not to quote one for the other.
Now the part I'd actually lead with when asked how to raise it. The argument is almost never about the arithmetic, it's about the classification. Deciding that 400 FIT are safe, meaning that a fault there can't propagate to a hazardous output, is a claim, and it's much cheaper than adding a mechanism. So it's where analyses get contested in review, and it's where a fault-injection campaign earns its keep. Inject into the elements you claimed were safe and see whether anything reaches an output. So my first move on a marginal SPFM is to re-examine the safe-fault classification with injection evidence, before I add hardware. My second is to look at where the residual FIT is concentrated, because it's usually one or two structures, and cover those specifically rather than blanket-adding protection.
The follow-up. "What's the latent fault metric and why is it separate?"
It's about a fault that does nothing on its own and isn't detected, so it silently disables a safety mechanism and waits for a second fault the now-broken mechanism was supposed to catch. The canonical example is the comparator in a lockstep pair stuck at "match". The pair keeps running, everything looks fine, and the redundancy the whole safety case rests on has quietly ceased to exist. So LFM asks what fraction of those you detect, which means you have to test the tester, periodically, typically by injecting a deliberate mismatch and confirming the error output asserts. That requirement is the reason runtime self-test of safety mechanisms exists at all.
The trap. Quoting the threshold numbers with total confidence and getting one wrong. Hedging costs nothing and a confidently wrong number is expensive.
Q18. Why do lockstep cores run with a delay between them?
Model answer. Because without it, a common-cause failure defeats the entire mechanism.
Dual-core lockstep is two identical cores getting the same inputs, with a comparator checking outputs every cycle. Any single random fault in one core produces a mismatch and the system goes to a safe state. It gives very high diagnostic coverage of core logic, which you can't get any other way. You can't put ECC on a pipeline. It costs more than double the area and power and gives zero performance, since the checker does no useful work. And it detects without correcting. A mismatch tells you something is wrong, not which one is right, so the response is a safe state, not a repair.
Now the delay. If the two cores are in exactly the same state in exactly the same cycle, then a supply droop, an EMI event, a clock disturbance, or anything else that hits both identically at the same instant can produce the same wrong result in both. The comparator sees a match and the fault sails straight through the mechanism the whole safety argument rests on. That's a common-cause failure and it's the failure mode redundancy is worst at.
The defence is temporal diversity. Run the checker a fixed number of cycles behind, typically one or two. A disturbance at a given instant then finds the two cores computing different instructions in different pipeline states, so its effect differs, so the comparison catches it. Structurally you delay the checker's inputs and delay the leading core's outputs by the same amount so the comparator sees aligned data. The delay lines on both sides are the cost of the idea.
The follow-up. "What else do you do about common-cause failures?"
Physical separation on the die, so a localised event such as a particle, a hot spot, or a supply anomaly in one region can't hit both. And sometimes layout diversity, implementing the checker with a different placement or orientation so a layout-dependent weakness doesn't appear identically in both. Each addresses a different channel, and dependent-failure analysis is exactly the exercise of enumerating the channels: shared clock, shared supply, shared reset, physical proximity, shared tooling. Shared clock and shared reset are the ones people forget, and they're the two most likely to defeat you.
The trap. Saying the delay is "for timing" or to help the comparator close. It buys a bit of that, but the reason it's in the architecture is common-cause failure, and that's what the question is testing.
Q19. Your chip ships. A cloud customer reports roughly one wrong answer per week across ten thousand machines. Attack it.
Model answer. The rate is the first piece of evidence. One event per week across ten thousand machines is far too rare to be a design bug that any workload would hit, and far too frequent to be a coincidence, so I'd start by placing it in the taxonomy: this is silent data corruption, and the question is which of three mechanisms.
First hypothesis, a marginal core, the mercurial-core phenomenon in the Google and Meta papers. Test: get the fleet to identify which machines and which cores, because if the events concentrate on a small number of cores that is diagnostic on its own. Then run known-answer tests on the suspect cores at a range of voltages, frequencies and temperatures, because these defects are famously sensitive to operating point and data pattern.
Second, an environmental or operating-point issue rather than a defective part. A droop event at a particular workload transition, an undervolted operating point that passes characterisation and fails on one instruction sequence, a thermal corner. Test: does the rate change with the voltage guardband or with frequency? If it does, it's margin, not a defect.
Third, an unprotected structure. Some path with no parity or ECC where a soft error goes undetected. Test: correlate against altitude or location if I have it, since neutron flux rises with altitude, and check whether the corruption pattern looks like a single bit.
In parallel I'd ask what instrumentation already exists, because the answer determines how fast this goes. If there are corrected-error counters, machine-check records with first-error-sticky, and per-core telemetry being collected, the data may already contain the answer. If there isn't, then that's the first finding and the first fix for the next product, because a defect at one in ten thousand cores is invisible per machine and obvious per fleet. You can only see it if you built the plumbing to aggregate it.
The follow-up. "Suppose it is a marginal core and you can't respin. What now?"
Mitigations in order of cost. Identify and quarantine: get the fleet to run periodic in-field tests and take suspect cores out of service, which is a serviceability answer and requires the ability to offline a core without a reboot. Change the operating point for affected parts if the sensitivity is to voltage or frequency, which trades power or performance for correctness on a subset. And for the highest-value computations, redundant execution with comparison at the software level. What I would not do is claim ECC fixes it, because the corruption is in the compute rather than in storage.
The trap. Debugging it as a logic bug. Logic bugs don't occur once per ten thousand machine-weeks. They occur whenever their condition occurs. The rate is telling you it's physical or marginal, and reasoning from the evidence rather than from your comfort zone is the thing being tested.
Q20. Design the always-on domain for a chip. What has to be in it, and why?
Model answer. This is the block that has to work when nothing else does, so I'd derive its contents from that requirement rather than list them.
Power management: the state machine that sequences every other domain, the sleep-transistor control, the isolation enables and the retention save and restore controls. It has to be always on by definition, because the thing that turns a domain back on cannot itself be in that domain.
Wake logic: whatever can wake the chip must be live and clocked. If a wake path runs through a synchroniser whose destination clock has stopped, it never resolves. The domain won't wake because the request can't arrive, and the request can't arrive because the domain is asleep. That deadlock is the single most important thing to get right in the whole block.
The system counter, because time must not stop when cores power down, and because a counter that stops is a counter every software timeout in the system is wrong about afterwards.
Enough of the interrupt controller to receive and hold a wake interrupt. In the GIC's structure, the per-core redistributor is exactly where the architecture put the interaction between interrupts and a core's power state, which is not an accident.
The debug infrastructure: the transport, the debug registers, the trigger configuration. Debug has to work when the core is broken, so its clock, power and reset all have to be independent of the thing being debugged, and it needs its own reset so that resetting the core doesn't drop the connection.
The RAS error records for anything that can fail while the rest is down, plus the first-error sticky state, because an error log in a domain that gets powered off is a log you can't read after the failure.
And the reset controller and the fuse or security state that decides whether debug is permitted at all.
Then the two constraints that shape all of it. Everything in there leaks all the time, by definition, so it's kept deliberately small and built from high-threshold cells wherever timing allows. And everything in there is on an always-running clock, so it's excluded from aggressive clock gating and shows up as the residue in any gating-coverage number. That is worth volunteering, because someone who reports 95 percent coverage without being able to say what the other 5 percent is hasn't looked.
The follow-up. "What's the hardest bug you'd expect in that block?"
Ordering, on the way out of a low-power state. Isolation is the first thing asserted going down and the last thing released coming up, and if it's released early, after the rail is up but before retention is restored and reset is released, then the domain's outputs are whatever the power-up transient left, effectively random, and those are visible to the always-on logic that's live and clocking. A spurious request starts a transaction into a block that isn't ready. A spurious interrupt fires. A state machine in the controller takes a transition it should never take. And since that controller is running the wake sequence, the wake itself fails. It's a one-line ordering error with a system-level symptom, it's timing- and temperature-dependent, and ordinary RTL simulation can't see it at all because the simulator has no notion of supply. You need power-aware simulation reading the power intent, or a formal property over the sequence.
The trap. Listing blocks without deriving them. The list is memorisable. The derivation from "it must work when nothing else does" is what shows you've built one.
11.Part 12, check yourself
Answer out loud, in full sentences, as an interviewer would hear them. If you cannot, reread the section named.
- Price polling for three devices with a five-microsecond deadline, then say what breaks at thirty devices and what breaks at a hundred. (1.2)
- Derive the interrupt controller from the one-wire-per-device design. What exactly is being factored out of the core, and why does it get worse with four cores? (1.3)
- Give the distinct failure mode of a level-sensitive source and of an edge-sensitive source, and give the ordering rule that prevents each. (1.4)
- Two devices share one level line. What must the handler chain do, and what happens if it stops at the first match? (1.4)
- Walk the four states of an interrupt source and say what end-of-interrupt is for. What happens if you EOI before clearing the device, and what happens if you never EOI? (2.3)
- Why does GICv3 split EOI into a priority drop and a deactivation? Who needs that and why? (2.3)
- Name the three different places masking happens, say which live in the controller and which lives in the core, and say why a driver should mask one source rather than disabling interrupts globally. (2.2)
- What is priority grouping and what problem does the binary point solve? (2.1)
- Name the four GIC interrupt classes, say which are private and which are shared, and say why message interrupts keep their configuration in memory rather than in registers. (3.1, 3.2)
- Give three reasons the industry moved to message-signalled interrupts that are not about pin count. (3.4)
- What does the ITS translate, where does the DeviceID come from, and why does that make it a security mechanism? (3.5)
- Compare the GIC and the PLIC on preemption. What does the PLIC do instead, and what property of the claim register makes it multi-core safe? (3.6)
- Why is the system counter's frequency fixed and unrelated to the core clock, and why does firmware rather than hardware populate the frequency register? (4.2)
- Explain why two cores can read different values from one system counter at the same real instant, working the tick and flight-time numbers. Then give the software symptom. (4.3)
- What four properties must the debug subsystem have, and derive all four from the single requirement that it must work when the core is broken. (6.1)
- Core 0 halts holding a modified cache line. What must remain live, and what happens if it does not? (6.2)
- Compare a hardware and a software breakpoint. Why are watchpoints often imprecise on an out-of-order core, and why do implementations accept that? (6.3)
- Explain the RISC-V abstract command and program buffer, and state the general trade they illustrate. What third mechanism exists for when the hart is too broken to execute? (6.5)
- Compute the raw instruction-trace bandwidth for a 4-wide 3 GHz core at IPC 2, then price it against a trace port, a 1 MB buffer and a memory channel. (7.2)
- Derive branch-trace compression from the observation that the host has the binary. Give the resulting bit rate, and list the four things that still have to be transmitted. (7.3, 7.4)
- Why is trace lossy by design, and what is the alternative and its cost? (7.4)
- Eight cores merge into a funnel. Why is the merged order not the event order, what fixes it, and what is the residual limitation? (7.9)
- Fill in the detected-versus-corrected two-by-two, name each box, and say which box has no defence and why. (8.2, 8.3)
- What are the reported properties of mercurial cores, and which conventional mitigation does not help against them? (8.3)
- Derive poison from the decision the hardware faces when a cache line fails ECC. Then give its four costs, including the partial-write hazard and the speculation constraint. (8.4)
- Why must RAS logic have error injection designed in, and what is the cheapest useful injection mechanism? (8.5)
- Compute availability for MTBF 10,000 hours with MTTR 4 hours, then with MTTR 4 minutes, and say what that comparison proves about where to spend effort. (8.1)
- What fields belong in an error record, and which one do designers most often omit? Explain firmware-first versus OS-first. (8.6)
- Give three examples of RAS requirements that change the microarchitecture rather than adding a block. (8.7)
- Distinguish systematic from random faults and say why each gets a completely different treatment. (9.3)
- Define SPFM and LFM. Work an SPFM example, then say where the real argument in such an analysis actually lies. (9.4)
- Why is a lockstep pair delayed by one or two cycles? Name two other common-cause defences and the two shared resources people forget. (9.6)
- What is a safety island, what problem does it solve, and what does its correctness depend on? (9.7)
- List what has to be in the always-on domain and derive each item from the requirement that it works when nothing else does. (Q20)
12.Part 13, related notes
- Power Fundamentals and Clock Gating for the always-on domain every block in this note lives in, for the isolation and retention sequencing behind Q20's ordering bug, and for why the wake path cannot be clock gated
- DFT and Silicon Debug for the JTAG TAP that Part 6.4 builds on, for the home-grown trace buffers and triggers that Part 7 standardises, and for the error-severity table and first-error-sticky discipline Part 8.6 extends
- SRAM Arrays and ECC for the coding theory behind every correctable error in Part 8, for syndromes, and for the arrays that runtime BIST tests in Part 9.7
- Reliability Aging and Variation for the physics of the random faults Parts 8 and 9 exist to survive, including soft errors and wear-out
- Clocking Reset and Domain Crossing for the synchronisers behind the counter-distribution uncertainty in 4.3, and for the reset architecture the debug and always-on domains depend on
- Arbiters FIFOs and CAMs for the priority arbitration that is most of what an interrupt controller physically is
- CPU Foundations Pipeline and Hazards for how a core takes an exception, which is the core-side half of everything in Parts 1 and 2
- Out of Order Execution for the retirement machinery that makes poison consumption a precise exception in 8.4
- Security Side Channels and Speculation for why speculative poison consumption is attacker-controllable, and for the debug-authentication argument in 6.7
- Front End and Branch Prediction for the other RAS, the return address stack, which the trace encoder in 7.3 reuses for return compression
- Virtual Memory and Memory Ordering for the translation machinery the IOMMU of Part 5 duplicates on the device side
- SoC Integration and Interfaces for the integration contract around system IP, and for DMA and the device side of Part 5
- Interconnect and AMBA for the fabric that carries poison, message-signalled interrupts and trace, and for the quality-of-service mechanisms recruited for freedom from interference in 9.7
- DRAM Controllers JEDEC and DFI for the read-modify-write path that Part 8.4's partial-write poison hazard rides on, and for the memory-side ECC schemes
- Verification Methodology for the formal-versus-simulation split that Part 11.2 applies to interrupt-controller and power-sequencing properties
- RISC V ISA Privileged and Vector for the privileged architecture the CLINT, PLIC and Debug Module attach to
- Cross Company Context and Behavioral for the per-company framing of the four areas in this note
- Exception and Interrupt Handling in a Pipelined CPU for the vault's core-side treatment of exceptions and interrupts
- I/O Architecture for the vault's treatment of DMA, PCIe and the IOMMU